What Is the Phillips Curve? How Inflation and Unemployment Shape Fed Policy and Financial Markets


Hello, this is MasterMind.
Why does the Federal Reserve pay so much attention to the labor market when its primary mission is controlling inflation? Why do investors closely watch the monthly jobs report even when inflation appears to be the biggest concern?
The answer begins with one of the most influential concepts in modern macroeconomics: the Phillips Curve.
Whether you're investing in the S&P 500, Treasury bonds, gold, or Bitcoin, understanding the Phillips Curve helps explain why markets react so strongly to employment reports, wage growth, and inflation data.
Although the relationship has evolved over the decades, it remains one of the key frameworks policymakers and investors use to interpret the economy and anticipate future monetary policy.

Key Takeaway
The Phillips Curve describes the relationship between unemployment and inflation, making it one of the most important frameworks for understanding Federal Reserve policy, interest rates, liquidity, and long-term market trends.
What Is the Phillips Curve?
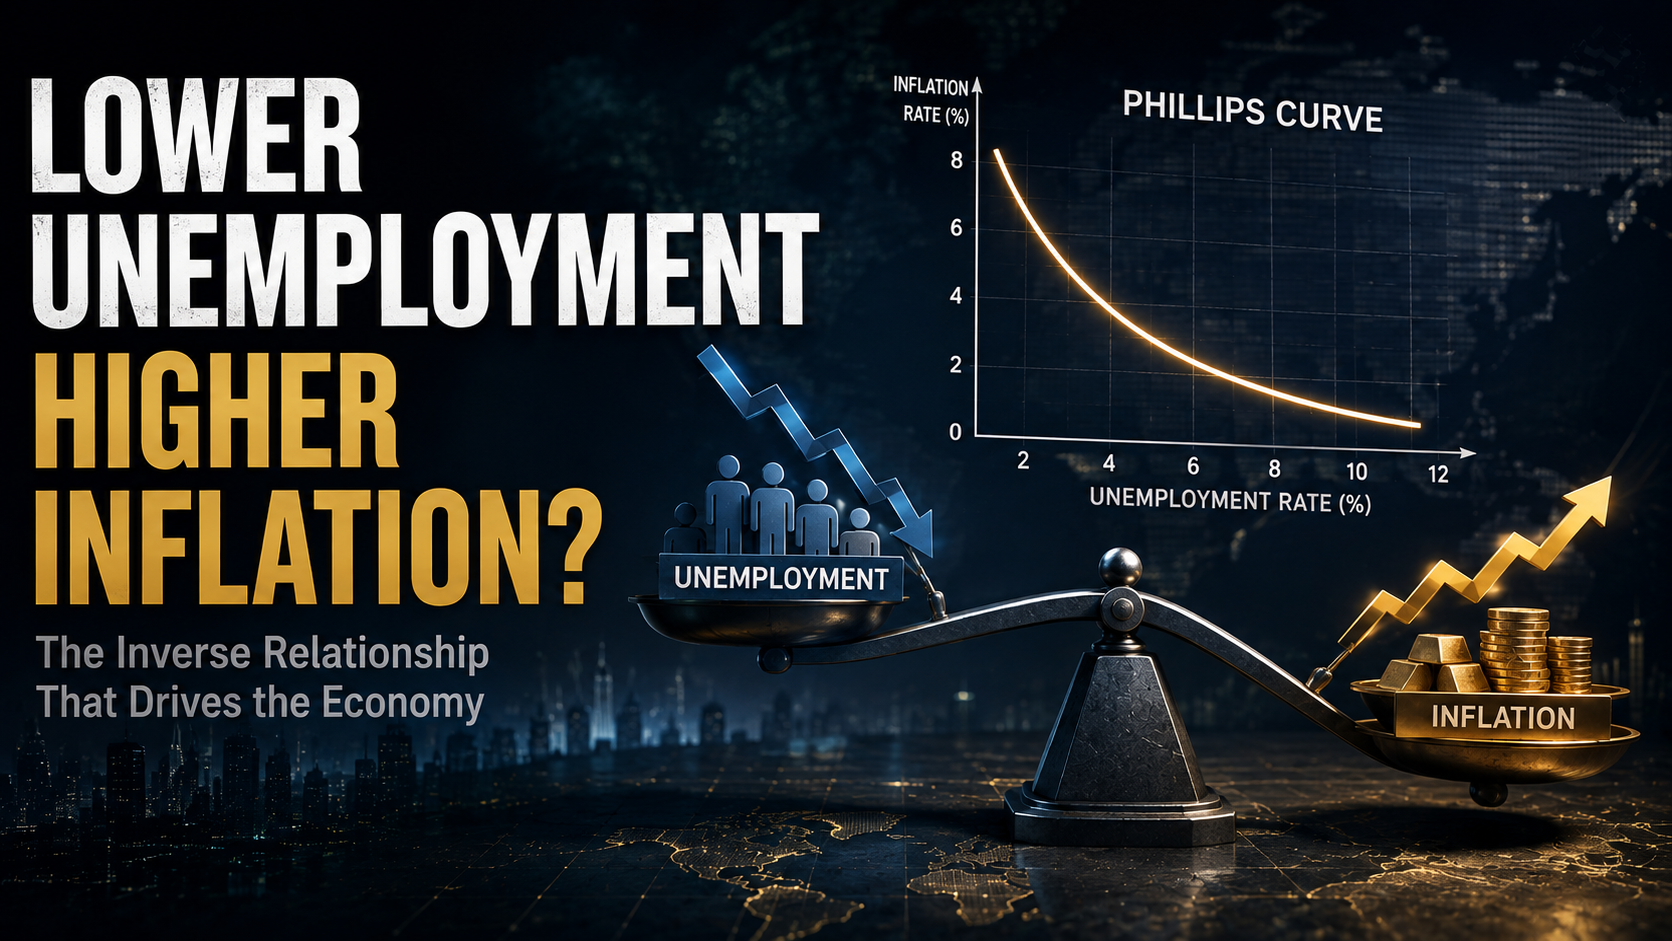
The Phillips Curve is an economic theory suggesting that inflation and unemployment tend to move in opposite directions over the business cycle.
The concept was introduced in 1958 by economist A. W. Phillips, who analyzed more than a century of labor market data from the United Kingdom.
His research found a consistent pattern
- When unemployment falls, inflation often rises.
- When unemployment rises, inflation tends to slow.
While the original model focused on wage inflation, economists later expanded the idea to explain broader price inflation across the economy.
In simple terms
A tight labor market creates upward pressure on wages, which can eventually push consumer prices higher.
Imagine the economy as an engine.
Running the engine harder increases output, but it also generates more heat. Likewise, when businesses hire aggressively and unemployment remains exceptionally low, economic activity accelerates—but so does inflationary pressure.
Slow the engine down, and inflation cools. The trade-off, however, is weaker economic growth and higher unemployment.
How the Phillips Curve Works
The Phillips Curve begins with the labor market.
When economic growth is strong, businesses expand production and compete for workers.
As labor becomes scarce, employers must offer higher wages to attract and retain employees.
Higher wages increase household income, which boosts consumer spending.
Businesses facing stronger demand—and higher labor costs—often respond by raising prices.
The result is higher inflation.
The process generally follows this sequence
Lower Unemployment
        ↓
Tighter Labor Market
        ↓
Higher Wage Growth
        ↓
Stronger Consumer Spending
        ↓
Higher Business Costs
        ↓
Rising Inflation
The opposite occurs during an economic slowdown.
Higher unemployment weakens wage growth, consumers spend less, businesses lose pricing power, and inflation gradually moderates.
This relationship explains why labor market data receives as much attention as inflation reports during every Federal Reserve meeting.

Why the Phillips Curve Matters
For investors, the Phillips Curve is far more than an academic theory.
It provides insight into how the Federal Reserve is likely to respond to changing economic conditions.
The Fed operates under a dual mandate
- Maximum employment
- Price stability
These objectives often pull policymakers in opposite directions.
If unemployment becomes extremely low, wage pressures may accelerate inflation.
If inflation rises too far above the Fed's target, policymakers may increase interest rates—even if doing so slows economic growth.
Because of this balancing act, investors carefully monitor economic indicators such as
- Consumer Price Index (CPI)
- Core Inflation
- Nonfarm Payrolls
- Unemployment Rate
- Average Hourly Earnings
- Job Openings (JOLTS)
None of these reports should be viewed in isolation.
Markets interpret them together to estimate how the Federal Reserve will adjust monetary policy in the months ahead.
Ultimately, investors are not simply reacting to economic data—they are reacting to what that data means for future interest rates and liquidity.
Why the Phillips Curve Looks Different Today
The original Phillips Curve suggested a relatively stable inverse relationship between unemployment and inflation.
However, real-world economies have become far more complex.
During the 1970s, the United States experienced stagflation—a period of high inflation and high unemployment occurring simultaneously.
This challenged the traditional interpretation of the Phillips Curve and led economists to develop more sophisticated models.
Today, inflation is influenced by many additional factors, including
- Inflation expectations
- Energy prices
- Global supply chains
- Productivity growth
- Technological innovation
- Demographic changes
Artificial intelligence provides a good example.
If AI significantly improves worker productivity, businesses may produce more goods and services without hiring substantially more employees.
In that environment, unemployment can remain low without generating the same inflationary pressures seen in previous decades.
This is one reason many economists argue that the Phillips Curve has become flatter than it was in the past.
Even so, the framework remains highly relevant because Federal Reserve officials continue to evaluate inflation alongside labor market conditions when setting interest rates.
Markets evolve, but one principle rarely changes: expectations about future monetary policy often matter more than today's economic data.
How the Phillips Curve Affects Financial Markets

The Phillips Curve matters to investors because changes in unemployment and inflation can influence Federal Reserve policy, Treasury yields, liquidity conditions, and asset valuations.
However, financial markets do not respond to the unemployment rate or inflation rate in a mechanical way.
Investors are constantly asking a more important question
How will this data change the Federal Reserve’s next decision?
That distinction is critical.
A strong jobs report can be positive because it signals a healthy economy. But if wage growth is also accelerating and inflation remains elevated, the same report can push bond yields higher and pressure growth stocks.
Likewise, a weaker labor market can initially raise recession concerns. Yet if it increases the probability of interest-rate cuts, rate-sensitive assets may rally before the broader economy improves.
The market is therefore not pricing the current economy alone. It is pricing the expected path of monetary policy.
Phillips Curve Scenarios and Their Market Impact
| Economic Environment | Likely Fed Response Likely Fed Response | U.S. Stocks | Treasury Bonds | U.S. Dollar | Gold | Bitcoin |
| Low unemployment and persistent inflation | Higher rates for longer or additional tightening | Pressure on high-valuation growth stocks; pricing-power and resource companies may hold up better | Yields may rise and bond prices may fall | Often supported by relatively high U.S. rates | Inflation concerns may help, but high real yields can be a headwind | Liquidity pressure can increase volatility |
| Rising unemployment and cooling inflation | Rate cuts become more likely | Rate-sensitive growth stocks may benefit, but recession risk still matters | Yields may fall and bond prices may rise | May weaken as rate expectations decline | Can benefit from lower real yields and defensive demand | May benefit if liquidity expectations improve |
| High unemployment and high inflation | Policy options become constrained | Broad pressure due to weak growth and elevated costs | Bonds may struggle if inflation remains unanchored | Direction depends on relative global conditions | Often attracts attention as a store of value | Highly sensitive to risk appetite and liquidity |
| Low unemployment and stable inflation | Soft-landing environment | Generally supportive if earnings remain strong | More stable yields | Often range-bound | Less urgent safe-haven demand | Can perform if liquidity remains adequate |
This table is a framework, not a fixed prediction.
Each asset responds to several variables at once, including corporate earnings, fiscal policy, geopolitical risk, market positioning, and investor expectations.
Still, the Phillips Curve helps explain why labor-market data can move nearly every major asset class.
Impact on U.S. Stocks
Growth Stocks
Growth stocks are highly sensitive to interest rates because much of their valuation depends on profits expected far in the future.
When the labor market is tight and inflation remains persistent, investors may expect the Federal Reserve to keep rates elevated.
Higher discount rates reduce the present value of future earnings, which can place pressure on technology and other long-duration stocks.
This does not mean every technology company must decline in a high-rate environment. Companies with strong free cash flow, dominant market positions, and durable earnings growth may remain resilient.
The important distinction is between businesses supported by real cash generation and those whose valuations depend mainly on cheap capital.
Value and Cyclical Stocks
During the early stages of an economic expansion, falling unemployment can support banks, industrial companies, consumer businesses, and other cyclical sectors.
However, if the economy becomes overheated and the Fed tightens aggressively, that advantage may eventually reverse.
The same strong economy that initially supports profits can later produce higher borrowing costs, weaker demand, and margin pressure.
Companies With Pricing Power
When inflation rises, businesses that can pass higher costs on to customers tend to be better positioned than those operating in highly competitive, low-margin industries.
Investors should therefore examine whether a company can preserve margins when labor, financing, and input costs rise.
Impact on Treasury Bonds
Bond markets often react to the Phillips Curve more directly than stock markets.
If unemployment is low, wage growth is strong, and inflation remains above target, investors may demand higher yields to compensate for tighter monetary policy and inflation risk.
Because bond prices and yields move in opposite directions, rising yields generally mean falling prices for existing bonds.
The reverse can occur when unemployment rises and inflation cools.
Investors may anticipate rate cuts, causing Treasury yields to decline and bond prices to rise.
However, investors should distinguish between two very different scenarios
- Healthy disinflation: Inflation falls while growth remains stable.
- Recessionary disinflation: Inflation falls because demand and employment are deteriorating sharply.
Both scenarios may support bonds, but they can have very different implications for stocks and corporate credit.
Impact on the U.S. Dollar
The U.S. dollar is heavily influenced by relative interest rates.
If the U.S. economy remains stronger than other major economies and the Fed maintains higher rates, global capital may continue flowing toward dollar-denominated assets.
That can support the dollar.
If unemployment rises and the Fed begins cutting rates faster than other central banks, the dollar may weaken.
Still, the dollar is not driven by U.S. policy alone. Global risk aversion can strengthen the dollar even when U.S. growth slows because investors often seek liquidity and safety during periods of stress.
Impact on Gold
Gold does not produce cash flow, so its opportunity cost tends to rise when real interest rates increase.
For that reason, persistent inflation combined with aggressive Fed tightening can create mixed conditions for gold.
Inflation fears may support demand for a store of value, while high real yields can make interest-bearing assets more attractive.
Gold often performs better when investors expect
- Lower real interest rates
- Easier monetary policy
- Currency weakness
- Financial instability
- Persistent inflation uncertainty
The key variable is not inflation by itself, but the interaction between inflation, interest rates, and confidence in the policy response.
Impact on Bitcoin
Bitcoin is often described as an inflation hedge, but its market behavior has frequently been more closely connected to liquidity and risk appetite.
When the labor market is strong, inflation remains sticky, and the Fed keeps policy tight, financial conditions can become less supportive for speculative assets.
When unemployment rises and rate-cut expectations increase, Bitcoin may benefit from renewed liquidity expectations.
However, rising unemployment can also signal recession risk and trigger broad deleveraging.
Bitcoin therefore reacts not only to inflation but also to
- Real interest rates
- Dollar strength
- Global liquidity
- Institutional positioning
- Risk appetite
For investors, the broader lesson is that a fixed label such as “inflation hedge” cannot fully explain how an asset behaves across different macroeconomic regimes.
What Investors Should Watch
1. Wage Growth
The unemployment rate alone does not reveal the full condition of the labor market.
Average hourly earnings and broader wage measures can provide a clearer view of inflationary pressure.
If wage growth remains elevated, service-sector inflation may be difficult to reduce.
A modest rise in unemployment may therefore be insufficient to justify rapid rate cuts.
2. Labor Demand
Job openings, hiring rates, layoffs, and quit rates help investors assess whether the labor market is truly cooling.
A decline in job openings without a sharp rise in unemployment can indicate that labor-market pressure is easing gradually.
This is often associated with the soft-landing scenario markets prefer.
3. Inflation Expectations
The modern Phillips Curve includes expectations.
If households and businesses believe inflation will remain high, workers may demand larger wage increases and companies may raise prices more aggressively.
This can make inflation more persistent.
If expectations remain anchored, inflation may decline with less damage to employment.
4. Productivity
Productivity can change the relationship between employment and inflation.
When workers produce more per hour, businesses can raise wages without increasing prices by the same amount.
This is particularly important in discussions about artificial intelligence, automation, and capital investment.
Higher productivity could allow stronger economic growth with less inflationary pressure.
But investors should separate measurable productivity gains from speculative promises.
5. Financial Conditions
The Federal Funds Rate is only one part of monetary policy.
Investors should also watch
- Treasury yields
- Mortgage rates
- Corporate credit spreads
- Lending standards
- Equity valuations
- Dollar strength
Even if the Fed stops raising rates, financial conditions can remain restrictive.
The Phillips Curve affects markets through this broader transmission mechanism.
What Do Wealthy Investors Look for in This Cycle?
Experienced investors do not treat the Phillips Curve as a simple signal to buy or sell.
They use it to assess where capital is moving, which cash flows are durable, and which assets can survive a change in the policy regime.
Capital Flows
When inflation remains high and the Fed is expected to maintain tight policy, capital often moves away from highly leveraged and speculative assets toward cash, short-term Treasuries, and businesses with dependable earnings.
When inflation cools and rate-cut expectations rise, capital may rotate back toward longer-duration assets.
The opportunity often appears before the economic data looks comfortable because markets move on changing expectations.
Cash Flow
High interest rates expose weak business models.
A company that depends on continuous refinancing or distant future profits may struggle when capital becomes expensive.
By contrast, companies with strong free cash flow, manageable debt, and pricing power can often endure a longer period of restrictive policy.
Asset Resilience
A resilient asset does not require one perfect macroeconomic outcome.
It can survive slower growth, higher financing costs, or temporary pressure on demand.
This is why balance-sheet quality and liquidity matter as much as growth potential.
Long-Term Perspective
Economic cycles repeatedly move between overheating and cooling.
Attempting to predict every monthly data release is rarely a durable strategy.
The more useful question is whether a portfolio can remain intact when the market’s preferred narrative changes.
Question for investors
Can the assets in my portfolio survive if inflation remains persistent and interest rates stay high longer than expected, or do they depend entirely on cheap money and optimistic assumptions?
The Deeper Market Insight
The Phillips Curve is not valuable because it offers a perfect forecast.
It is valuable because it helps investors understand the chain connecting labor markets, inflation, Federal Reserve policy, interest rates, and asset prices.
That chain can be summarized as follows
Labor Market Conditions
        ↓
Wage and Inflation Pressure
        ↓
Federal Reserve Expectations
        ↓
Interest Rates and Financial Conditions
        ↓
Capital Flows and Asset Valuations
The most important market variable is often not the latest number itself.
It is the gap between what investors expected and what the data implies for the future.
A strong employment report can hurt markets when investors expected rate cuts.
A weak employment report can lift markets when it supports easier policy—unless it is weak enough to signal a severe recession.
Markets are driven by expectations, disappointment, and the movement of liquidity.

Conclusion
The Phillips Curve describes the relationship between inflation and unemployment, but its significance extends far beyond an economics textbook.
It helps explain why the Federal Reserve watches wages and employment so closely, why Treasury yields respond to labor-market reports, and why stocks, the dollar, gold, and Bitcoin can react differently to the same economic data.
The relationship is no longer as simple or stable as it once appeared.
Supply shocks, inflation expectations, globalization, demographic changes, and productivity all influence the outcome.
Yet the central logic remains useful: a tight labor market can increase inflationary pressure, while a cooling labor market can reduce it—often at the cost of slower growth.
For long-term investors, the goal is not to predict every turn in inflation or unemployment.
The goal is to recognize how changing economic conditions affect policy, liquidity, and the survival value of each asset.
Markets are not moved by one number alone. They are moved by how that number changes expectations and redirects capital.
This was MasterMind.
'[Global] Success Blueprints' 카테고리의 다른 글