What Is Forward P/E? How to Calculate and Use the Forward P/E Ratio


Hello, this is MasterMind.
Is a stock trading at 30 times earnings expensive?
And if another stock trades at only 10 times earnings, is it automatically cheap?
These questions sound simple, but valuation rarely works that way.
A stock price does not reflect only what a company earned last year. The market continuously tries to price what a business could earn in the future. That is why one of the most widely followed valuation metrics on Wall Street is the Forward P/E ratio, also known as the forward price-to-earnings ratio.
Forward P/E compares a company's current stock price with its expected future earnings. Investors use it when evaluating individual companies as well as broader benchmarks such as the S&P 500 and Nasdaq.
But there is an important catch.
A low Forward P/E does not necessarily mean a stock is undervalued, and a high Forward P/E does not automatically mean a stock is overpriced.
To use the metric correctly, investors need to understand what is happening to the number underneath the valuation: expected earnings.
Key Takeaway
Forward P/E measures how much investors are currently paying for each dollar of a company's expected future earnings. It is most useful when combined with earnings revisions, growth expectations, interest rates, cash flow, and historical valuation ranges.
What Is Forward P/E?
Forward P/E stands for Forward Price-to-Earnings Ratio.
To understand it, we first need to look at the traditional P/E ratio.
The basic formula is
P/E Ratio = Current Stock Price ÷ Earnings Per Share (EPS)
If a stock trades at $100 and generates $5 in earnings per share, its P/E ratio is
$100 ÷ $5 = 20x
In simple terms, investors are paying $20 for every $1 of annual earnings represented by each share.
Forward P/E changes one critical part of that equation.
Instead of using historical earnings, it uses estimated future EPS.
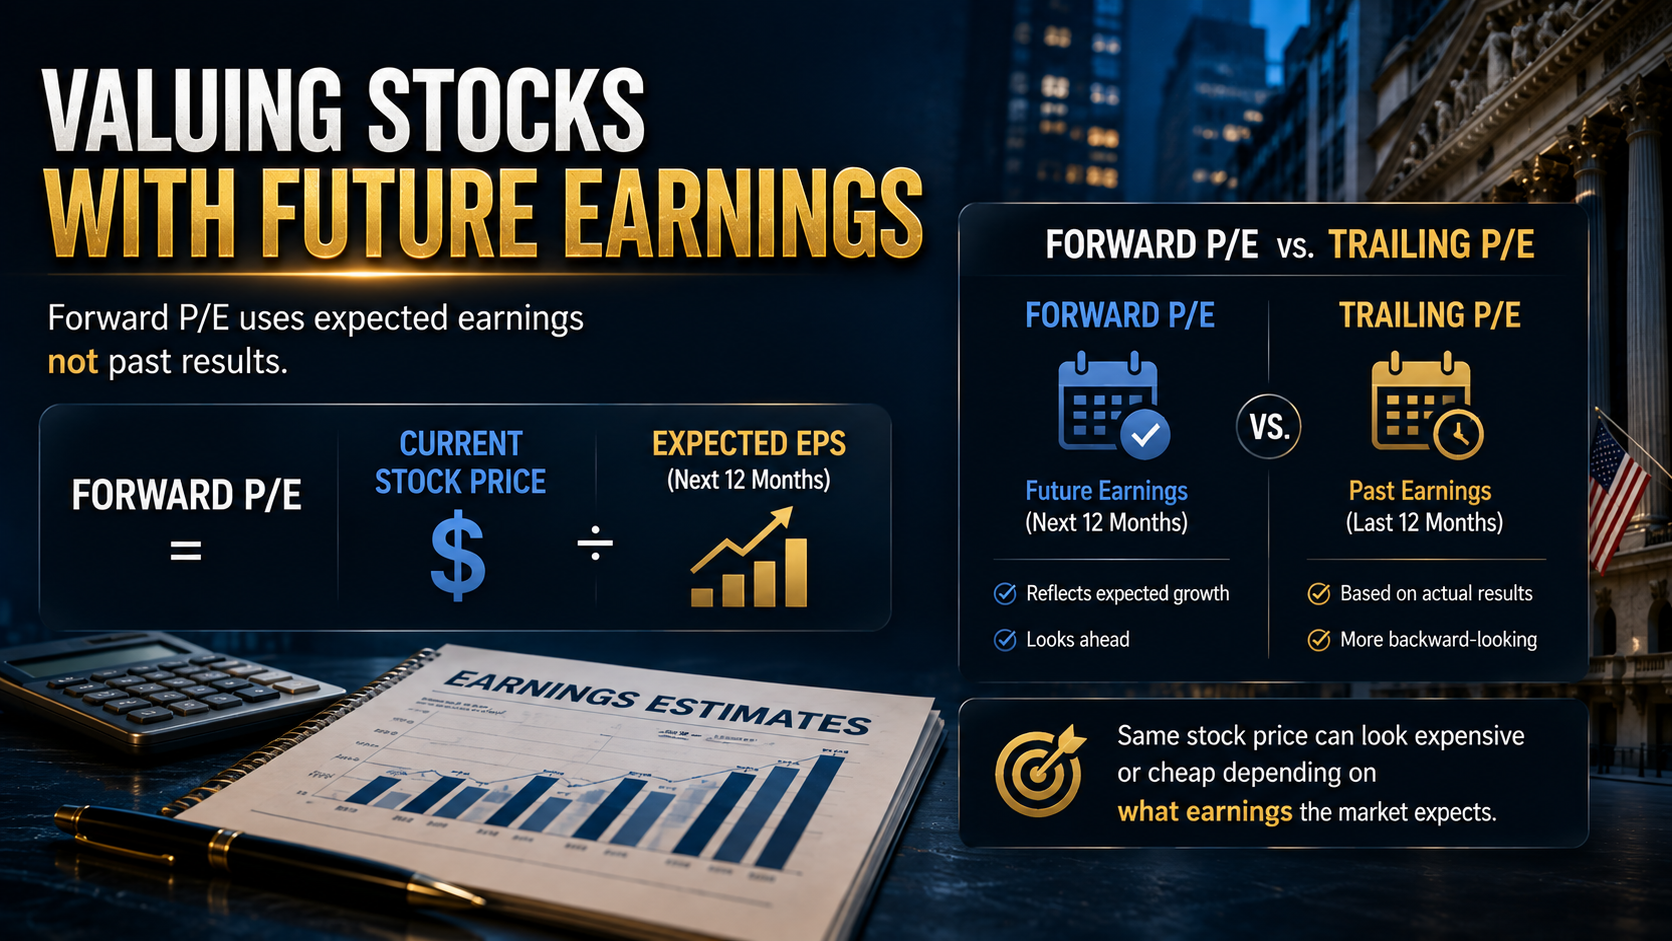
Forward P/E = Current Stock Price ÷ Expected EPS
In many market-data services, this is based on earnings estimates for the next 12 months or the next fiscal year. Investors should therefore check which definition a particular data provider is using before comparing valuation figures.
Suppose a stock trades at $100 and Wall Street expects it to generate $5 per share over the relevant forward period.
Its Forward P/E would be
$100 ÷ $5 = 20x
That tells us the market is currently paying approximately 20 times the company's expected earnings.
The most important word here is expected.
Those earnings have not happened yet.
Forward P/E vs. Trailing P/E
One of the easiest ways to understand Forward P/E is to compare it with Trailing P/E.
| Metric | Trailing P/E | Forward P/E |
| Earnings basis | Historical earnings | Estimated future earnings |
| Common period | Last 12 months | Next 12 months or next fiscal year |
| Main advantage | Uses actual results | Reflects expected growth |
| Main weakness | Can lag business changes | Depends on forecasts |
| Often useful for | Mature, stable businesses | Growth and cyclical companies |
Imagine a stock trading at $100.
If the company earned $5 per share during the previous 12 months
Trailing P/E = 20x
Now assume analysts expect EPS to rise to $10 during the forward period
Forward P/E = 10x
The same stock can therefore appear expensive based on historical earnings and much cheaper based on future earnings.
That difference is especially important for companies experiencing rapid changes in profitability.
Semiconductors are a good example. Earnings can move dramatically across an industry cycle, meaning a backward-looking P/E may tell investors relatively little about where profitability is heading.
However, historical earnings should not be dismissed.
Past results help investors determine whether management has actually demonstrated the ability to produce the growth currently embedded in forward estimates.
Forward P/E should complement historical analysis, not replace it.
How Is Forward P/E Calculated?
The calculation itself is simple.
The difficult part is estimating the denominator.
Step 1: Estimate Future Earnings
Wall Street analysts build earnings forecasts using factors such as
- Revenue growth
- Unit volumes
- Pricing
- Operating margins
- Labor and input costs
- Interest expense
- Currency movements
- Capital expenditures
- Industry conditions
- New products
- Management guidance
- Macroeconomic conditions
These assumptions eventually produce an estimate for net income and EPS.
Step 2: Build the Consensus Estimate
A widely quoted Forward P/E will often use an analyst consensus estimate rather than one analyst's forecast.
If multiple analysts cover a large U.S. company, their EPS estimates are aggregated into a market consensus.
That consensus changes constantly.
After an earnings report, product announcement, economic shock, or change in corporate guidance, analysts may raise or lower their forecasts.
Step 3: Compare Expected EPS With the Stock Price
The expected EPS is then compared with the current share price.
This means Forward P/E can change for two completely different reasons
the stock price changes, or the earnings estimate changes.
Understanding which side of the equation is moving is critical.
How Forward P/E Changes
Suppose a company trades at $100 and analysts expect $4 in EPS.
Its Forward P/E is
$100 ÷ $4 = 25x
Now assume analysts become more optimistic and raise expected EPS to $5.
If the stock remains at $100
$100 ÷ $5 = 20x
The stock did not fall, yet its Forward P/E became cheaper because expected earnings increased.
Now consider the opposite.
If expected EPS falls from $5 to $4 while the stock remains at $100, Forward P/E rises from 20x to 25x.
Nothing happened to the stock price.
What changed was the market's view of the company's earnings power.
This is one of the most important concepts in valuation
A stock can become more expensive without rising, and it can become cheaper without falling.
Why Is Forward P/E Important?
Financial markets are forward-looking.
Investors do not buy a company simply because it earned money in the past. They are purchasing a claim on cash flows the business may generate in the future.
That makes expected earnings extremely important.
Forward P/E attempts to connect two things
what investors are paying today and what the company is expected to earn tomorrow.
This becomes particularly useful when analyzing businesses undergoing rapid earnings changes.
Consider areas such as
- Artificial intelligence
- Semiconductors
- Cloud infrastructure
- Software
- Consumer cyclicals
- Energy
- Industrials
For companies in these industries, earnings one year from now can look dramatically different from earnings during the previous year.
Forward P/E gives investors a way to incorporate that change into valuation.
The Two Engines Behind Stock Prices
A useful way to understand stock returns is through a simple valuation identity
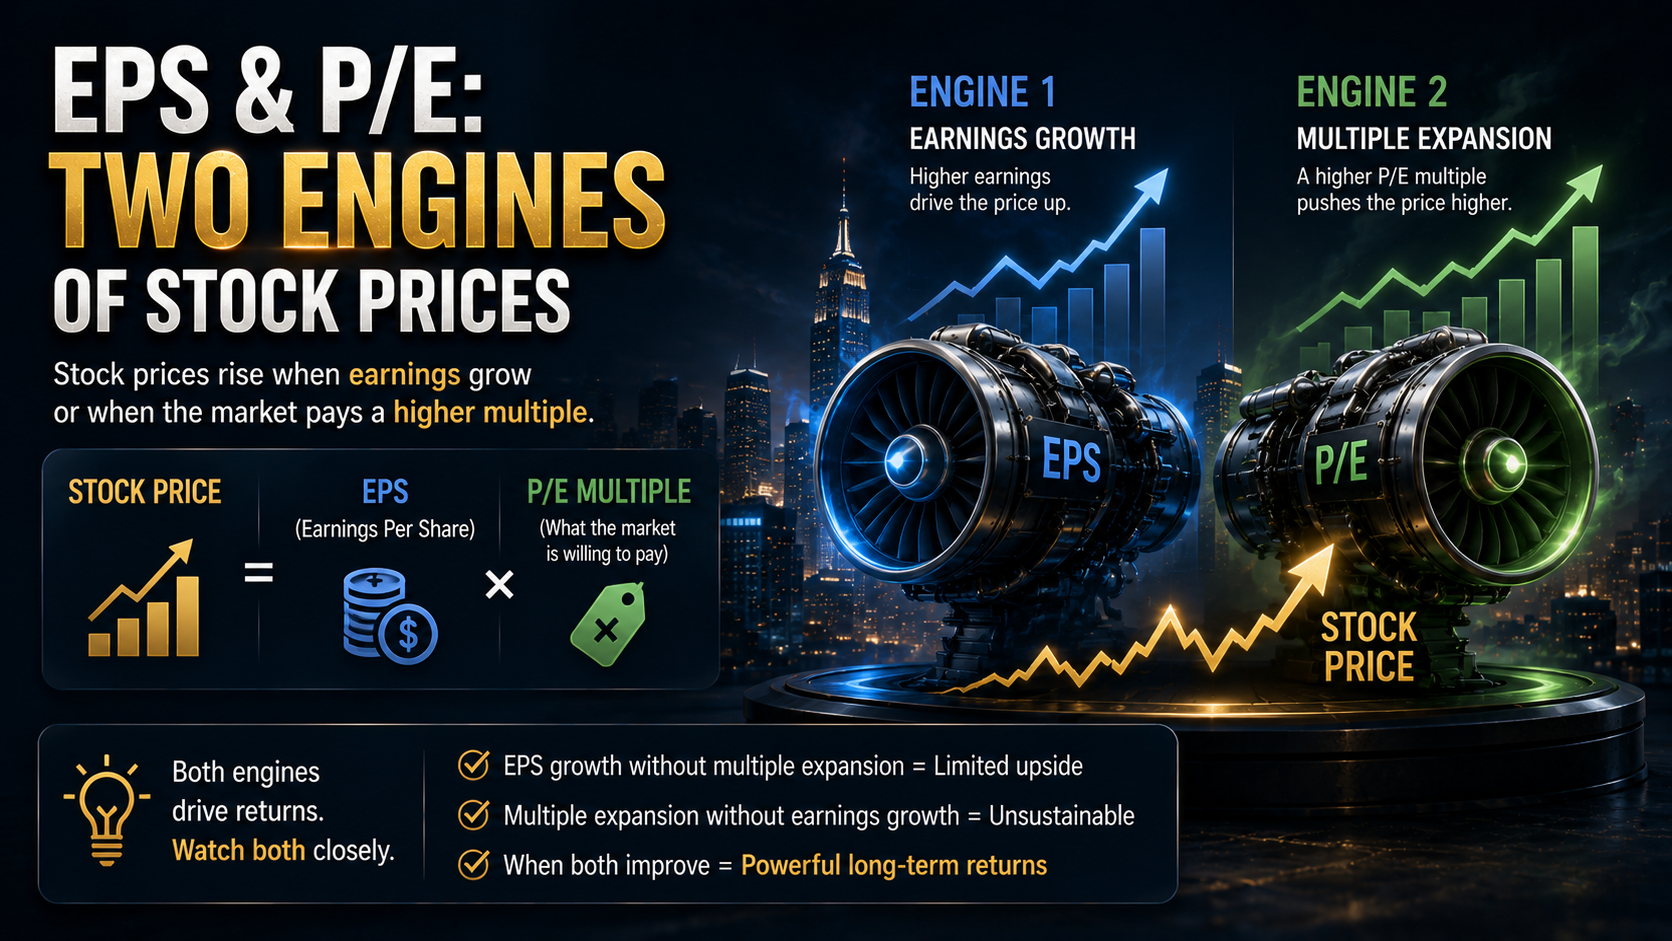
Stock Price = EPS × P/E Multiple
This relationship comes directly from rearranging the standard P/E formula.
It also illustrates two major forces that can drive a stock higher.
Engine 1: Earnings Growth
Assume a company earns $5 per share and trades at 20 times earnings.
Its implied stock price is
$5 × 20 = $100
If EPS increases to $6 while the P/E remains at 20
$6 × 20 = $120
The stock can rise because the business earns more.
Engine 2: Multiple Expansion
Now keep EPS at $5.
If investors become willing to pay 25 times earnings instead of 20
$5 × 25 = $125
The company's earnings did not change.
The market simply assigned a higher valuation to those earnings.
This is known as multiple expansion.
The reverse is called multiple compression.
And this explains something investors frequently experience
A company can report strong earnings and still see its stock decline.
If earnings rise 10% but the market decides the appropriate valuation multiple should fall 20%, multiple compression can overwhelm the earnings growth.
Why Earnings Revisions Matter So Much
The Forward P/E displayed on a financial website represents a snapshot.
Investors should also ask whether the underlying EPS forecast is moving higher or lower.
This is known as earnings estimate revision.
Imagine two companies both trading at 20 times forward earnings.
Company A has experienced repeated upward EPS revisions during the past several months.
Company B has experienced repeated downward revisions.
The headline valuation looks identical.
The underlying trends are not.
If Company A's expected earnings continue increasing, its Forward P/E could fall naturally unless the stock price rises at a similar pace.
If Company B's estimates continue falling, its Forward P/E could rise even if the share price goes nowhere.
This leads to a broader market principle
The direction of expectations can matter as much as the absolute number.
Is a Low Forward P/E Always Cheap?
No.
This is one of the most important mistakes investors can avoid.
Suppose a stock trades at $100 and consensus EPS is $10.
Forward P/E is only
10x
That might look inexpensive.
But now imagine an economic slowdown causes analysts to cut expected EPS from $10 to $5.
With the stock still trading at $100
Forward P/E becomes 20x.
The apparently cheap stock was partly an illusion created by an overly optimistic earnings estimate.
This is sometimes associated with a value trap: a security appears inexpensive based on a valuation metric, but the underlying business is deteriorating fast enough to justify the low valuation.
The denominator matters just as much as the multiple.
Why Forward P/E Can Be Tricky for Cyclical Stocks
Forward P/E requires extra caution with cyclical businesses.
Examples can include
- Semiconductors
- Chemicals
- Steel
- Energy producers
- Transportation
- Industrials
- Certain consumer discretionary businesses
During an economic or industry boom, earnings can become unusually high.
When EPS reaches a cyclical peak, P/E can become unusually low.
The stock suddenly looks cheap.
But if those earnings represent the top of the cycle rather than sustainable profitability, the low P/E may be misleading.
When the cycle reverses, EPS falls and the P/E expands.
This creates one of the great paradoxes of cyclical investing
A cyclical stock can look cheapest near peak earnings and most expensive near an earnings trough.
That is why investors evaluating cyclical businesses often need to think in terms of normalized earnings across a full cycle rather than relying on one year's forecast.
Forward P/E and Interest Rates
Interest rates are another major piece of the valuation puzzle.
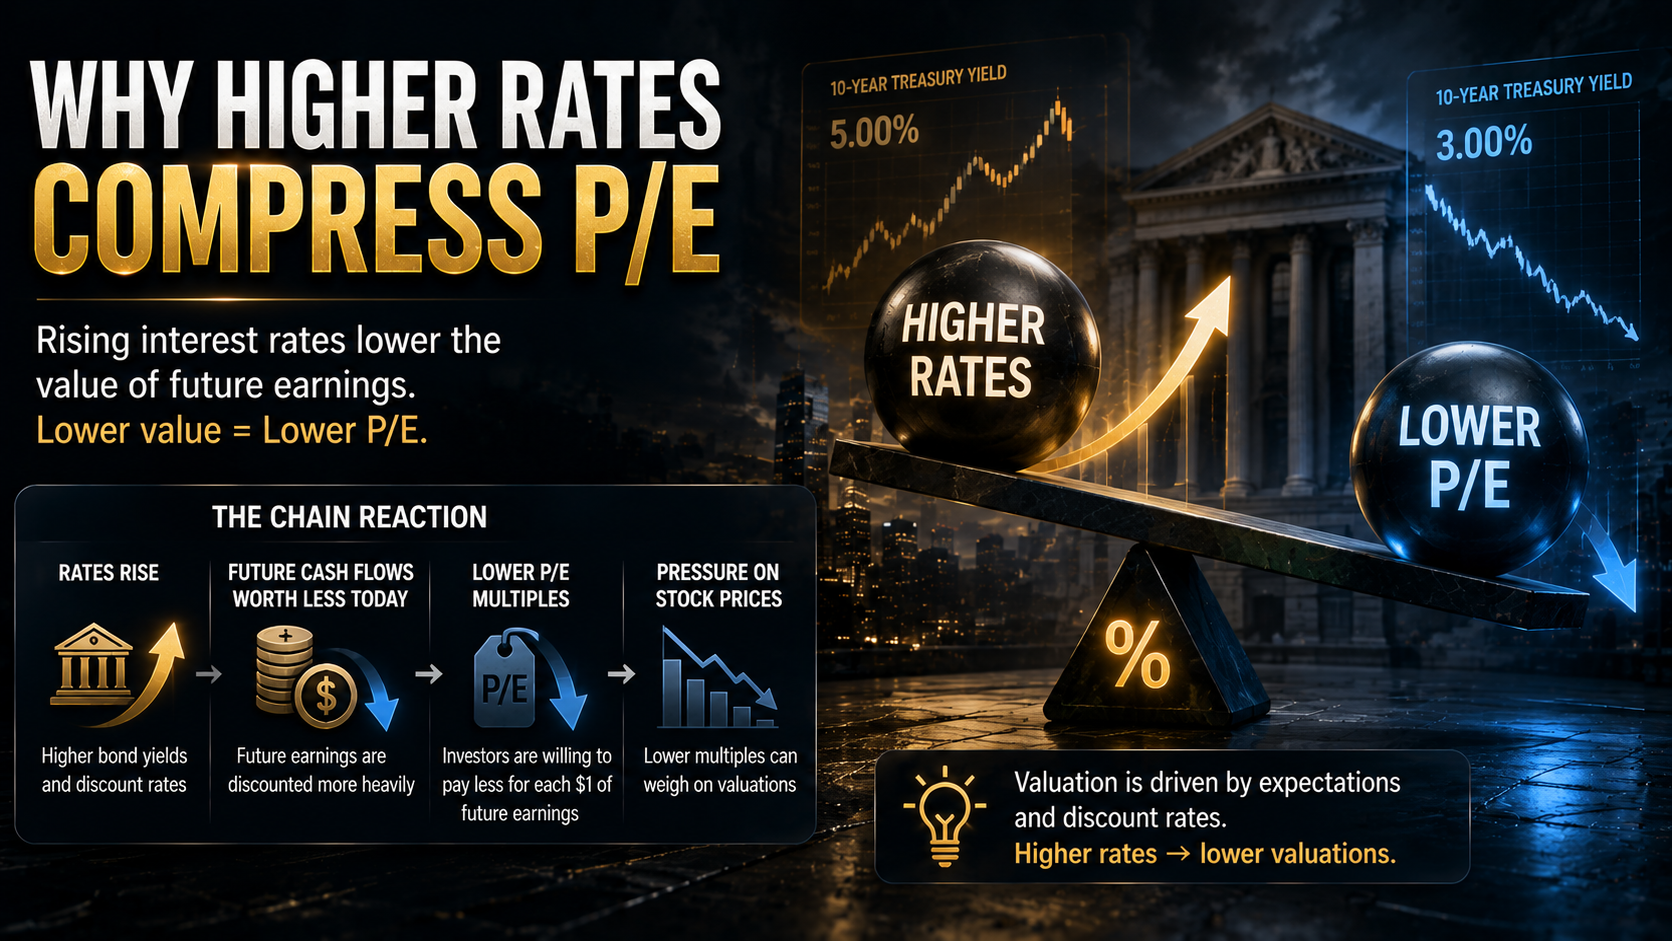
The economic value of a company ultimately depends on future cash flows discounted back to the present.
When interest rates rise, the discount rate applied to future cash flows generally increases.
That can reduce the valuation investors are willing to assign to those future earnings.
Growth companies can be particularly sensitive because a larger portion of their expected economic value may depend on profits far into the future.
This can produce multiple compression.
A company might continue growing its EPS while its stock struggles because the market is no longer willing to pay the same Forward P/E.
The opposite can occur when interest rates decline.
Lower discount rates can support higher valuation multiples.
But investors should avoid another oversimplification
Falling interest rates do not automatically mean higher stock prices.
If rates are falling because the economy is weakening rapidly, analysts may simultaneously reduce corporate earnings forecasts.
The positive effect of lower discount rates can then be offset by deteriorating EPS expectations.
How Forward P/E Connects With Other Asset Markets
Forward P/E is fundamentally an equity valuation metric. Bonds, gold, the U.S. dollar, and Bitcoin do not have corporate EPS and therefore do not have P/E ratios.
However, the forces influencing equity valuations—interest rates, economic growth, liquidity, inflation, and risk appetite—also influence other asset classes.
| Asset | Connection to the Valuation Environment |
| U.S. equities | Directly affected by earnings and valuation multiples |
| Treasuries | Yields influence discount rates and relative asset attractiveness |
| U.S. dollar | Influenced by rates, growth expectations and global capital flows |
| Gold | Sensitive to real yields, uncertainty and monetary conditions |
| Bitcoin | Often sensitive to liquidity and broader risk appetite |
The relationship is not mechanical.
For example, a high S&P 500 Forward P/E does not automatically cause investors to buy gold or Bitcoin.
Instead, investors should examine the common macro forces driving multiple asset classes.
The more useful question is
Where is capital moving, and what change in expectations is causing that movement?
How Investors Should Use Forward P/E
Forward P/E becomes far more useful when combined with other information.
Compare Similar Businesses
A bank and a cloud software company should not automatically trade at the same P/E.
Their growth rates, capital requirements, margins, competitive structures, and risks are different.
Relative valuation generally becomes more meaningful when comparing companies operating in similar industries.
Compare With the Company's Own History
Investors can compare the current Forward P/E with the company's historical valuation range.
If a company typically traded between 15x and 20x forward earnings but now trades at 30x, investors should ask what changed.
Perhaps growth accelerated dramatically.
Or perhaps expectations simply became much more optimistic.
Historical averages provide context, not an automatic buy or sell signal.
Watch Earnings Revisions
Is consensus EPS moving up or down?
A declining Forward P/E accompanied by rising earnings estimates can mean something very different from a declining Forward P/E caused entirely by a collapsing stock price.
Examine Cash Flow
EPS is an accounting measure.
Investors should also examine whether earnings are being converted into actual cash.
Operating cash flow and free cash flow can help investors evaluate the quality of reported profits.
A company reporting strong EPS growth while consistently producing weak cash flow deserves closer examination.
Consider the Interest-Rate Environment
A 30x Forward P/E can carry different implications depending on Treasury yields, inflation expectations, growth rates, and the company's own earnings trajectory.
Valuation never exists in a macroeconomic vacuum.
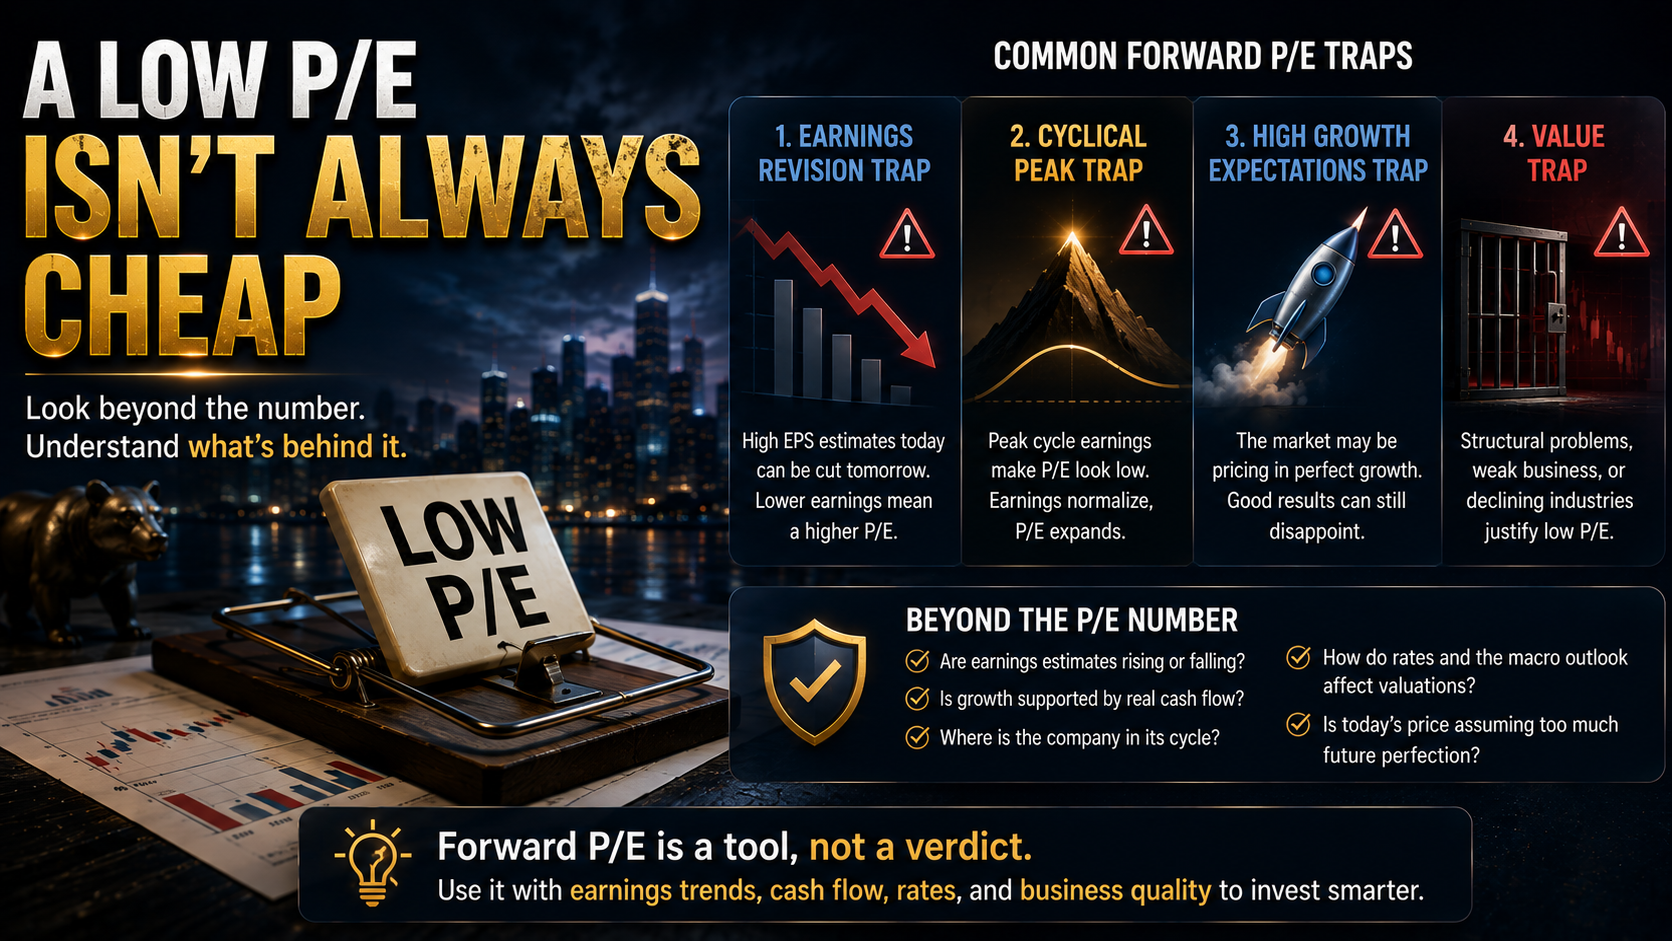
Common Forward P/E Traps
The Earnings Revision Trap
A stock looks cheap because consensus earnings are high.
Analysts then cut EPS estimates.
The denominator falls, and the stock suddenly looks much more expensive.
The Cyclical Peak Trap
A cyclical company generates record profits.
Those profits make the P/E appear extremely low.
Then the industry cycle turns and earnings normalize.
What looked like a bargain was actually being valued on peak earnings.
The High-Growth Expectations Trap
A rapidly growing company can deserve a higher valuation than a mature business.
But a high Forward P/E also means the market may already be pricing in substantial future growth.
The company can report good results and still disappoint investors if those results fail to meet elevated expectations.
The Consensus Trap
Analyst consensus is not certainty.
Unexpected recessions, supply shocks, competitive threats, regulatory changes, technological disruption, or execution problems can quickly make estimates obsolete.
Forward P/E therefore contains an unavoidable forecasting risk.
What Do Long-Term Investors Look for Beyond Forward P/E?
Sophisticated long-term investors rarely stop at the question
"What is the Forward P/E?"
They want to understand what is behind the number.
Follow the Money
Comparing valuations across the S&P 500 and sectors such as technology, financials, energy, industrials, and healthcare can provide clues about where investors are assigning the greatest expectations.
But valuation alone does not prove capital flows.
ETF flows, trading activity, institutional positioning, and earnings revisions can provide additional evidence.
Examine Cash-Flow Quality
Expected EPS is useful, but a durable business ultimately needs to generate cash.
Long-term investors therefore examine whether accounting profits translate into operating and free cash flow.
Evaluate Business Resilience
What happens if growth slows?
What happens if rates stay high?
What happens if margins fall?
Companies with strong balance sheets, pricing power, recurring demand, and durable competitive advantages may have greater ability to survive periods when forecasts prove wrong.
Think Beyond the Next Quarter
Forward P/E usually focuses on a relatively short forecast horizon.
Long-term value, however, can depend on whether the company's earnings power can expand over many years.
This is where investors need to move beyond the multiple and examine the business itself.
Useful questions include
Are analysts raising or lowering expected EPS?
Is earnings growth supported by real cash flow?
Where is the company in its industry cycle?
How much future growth is already embedded in today's valuation?
Would the business remain financially strong if the optimistic forecast proves wrong?
These questions shift the focus from predicting the next stock-price move to evaluating survivability and long-term compounding potential.
That distinction matters.
Markets will always contain uncertainty. Successful investing is therefore not only about finding companies with attractive forecasts. It is also about avoiding situations where everything must go perfectly for the current valuation to make sense.
A Better Framework for Reading Forward P/E
Forward P/E works best as part of a broader valuation framework.
| Metric | What It Helps Investors Evaluate |
| Forward P/E | Price relative to expected earnings |
| EPS growth | Future earnings expansion |
| Earnings revisions | Direction of market expectations |
| Operating cash flow | Quality of reported earnings |
| Free cash flow | Cash available after necessary investment |
| Balance sheet | Financial resilience |
| Interest rates | Valuation and discount-rate environment |
| Peer P/E ratios | Relative valuation |
| Historical P/E range | Valuation context |
No single number can determine whether a stock is attractive.
Forward P/E should be viewed as the beginning of the analysis rather than the conclusion.
Final Thoughts
Forward P/E is one of the most useful valuation metrics available to U.S. equity investors because it connects today's stock price with tomorrow's expected earnings.
But its greatest strength is also its greatest weakness.
The earnings in Forward P/E have not happened yet.
That means a low Forward P/E does not automatically indicate undervaluation, just as a high Forward P/E does not automatically indicate a bubble.
Investors need to examine the direction of earnings estimates, cash-flow quality, interest rates, industry cycles, competitive positioning, and the valuation already embedded in the stock price.
The most important lesson is simple
Forward P/E does not tell you whether a stock is cheap or expensive by itself. It tells you how much the market is currently willing to pay for expected future earnings.
The deeper question is whether those earnings expectations are realistic.
In investing, the objective is not to predict the future perfectly. It is to understand what the market already expects—and to build a strategy capable of surviving when those expectations prove wrong.
This was MasterMind.
'[Global] Success Blueprints' 카테고리의 다른 글