What Is VWAP (Volume-Weighted Average Price)? Why It Matters to Investors and Institutional Traders


Welcome to MasterMind.
Have you ever wondered why two investors can buy the same stock on the same day, yet one is praised for great execution while the other is criticized for paying too much?
Most retail investors focus on where a stock is trading right now. Professional investors, however, often ask a different question
"What was the average price the market actually traded at today?"
That question leads us to one of the most widely used institutional trading benchmarks: VWAP (Volume-Weighted Average Price).
Although it appears as a simple line on a trading chart, VWAP represents far more than a technical indicator. It reflects where the majority of capital changed hands during the trading session, making it one of the most important reference points for portfolio managers, traders, hedge funds, and algorithmic trading systems.
Understanding VWAP is not about predicting tomorrow's price. It's about understanding where money is flowing today, which often provides better context than price alone.
Key Takeaway
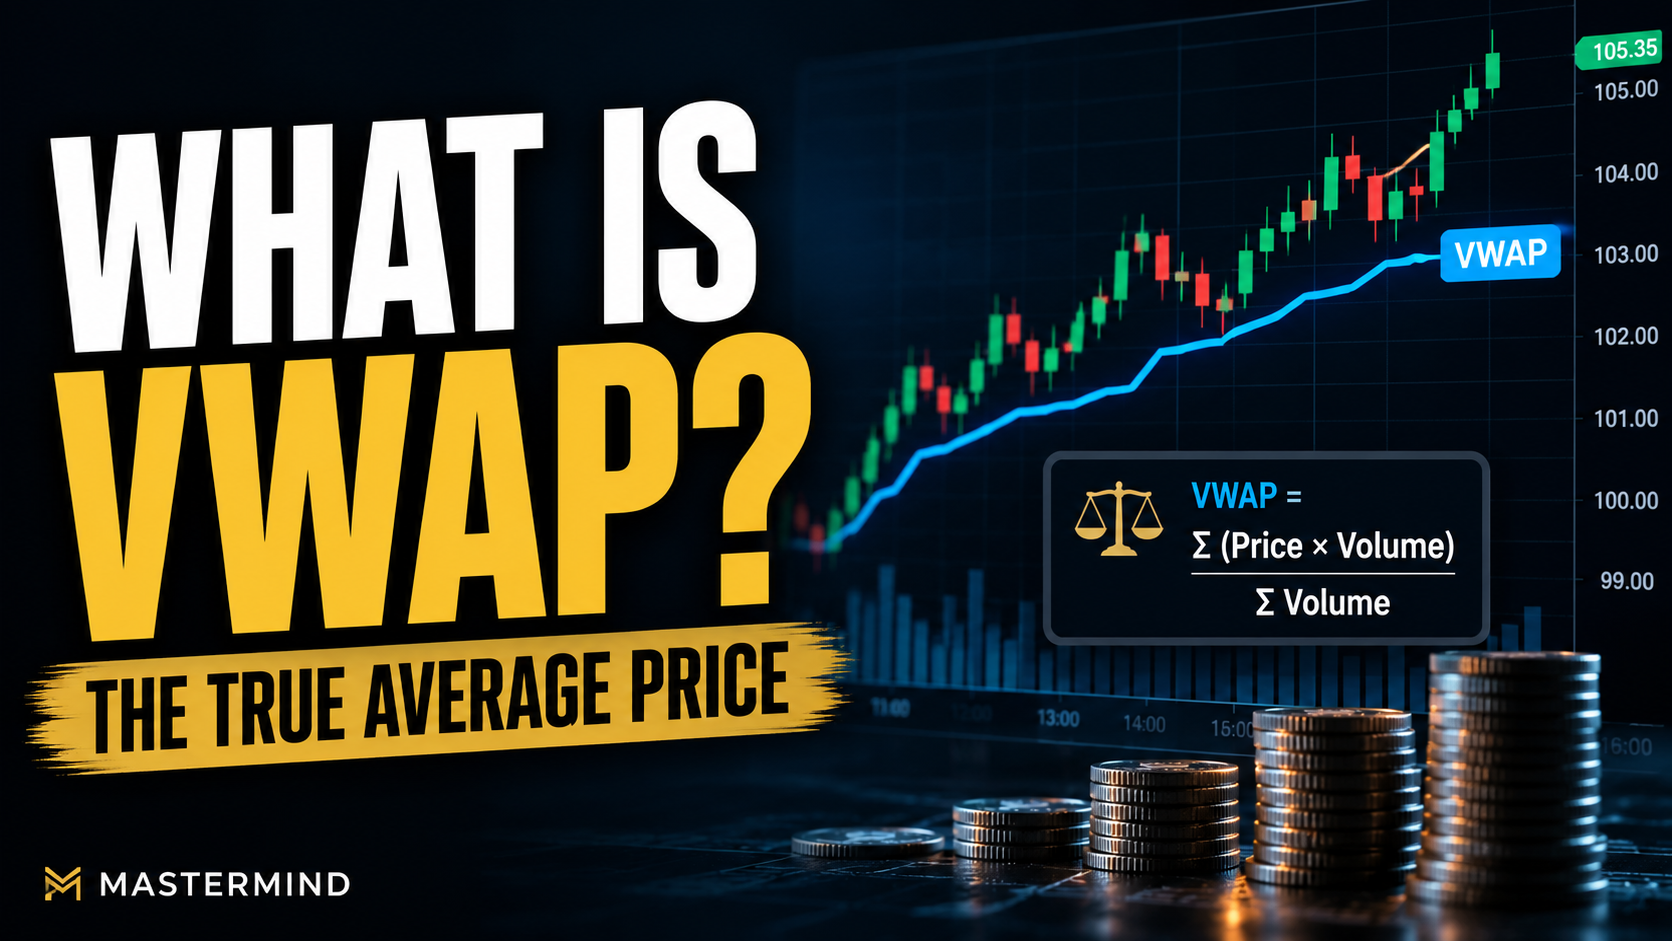
VWAP (Volume-Weighted Average Price) measures the market's true average trading price by weighting every transaction according to its trading volume, making it one of the most important benchmarks for institutional investors.
What Is VWAP?
VWAP stands for Volume-Weighted Average Price.
Unlike a simple average that gives every price equal importance, VWAP assigns greater weight to prices where more shares actually traded.
In other words, VWAP answers a simple but powerful question
"At what average price did the market actually transact today?"
This distinction is important because not every price carries the same significance.
Imagine a stock briefly trades at $100 with only a few hundred shares changing hands. Later, millions of shares trade around $102.
A simple average would treat both prices equally.
VWAP does not.
Because most of the market's capital traded near $102, VWAP will remain much closer to that level.
For this reason, many institutional traders view VWAP as the market's true average cost basis for the day rather than just another chart indicator.
Why Does VWAP Matter?
Markets are not driven by price alone.
They are driven by capital moving through price levels.
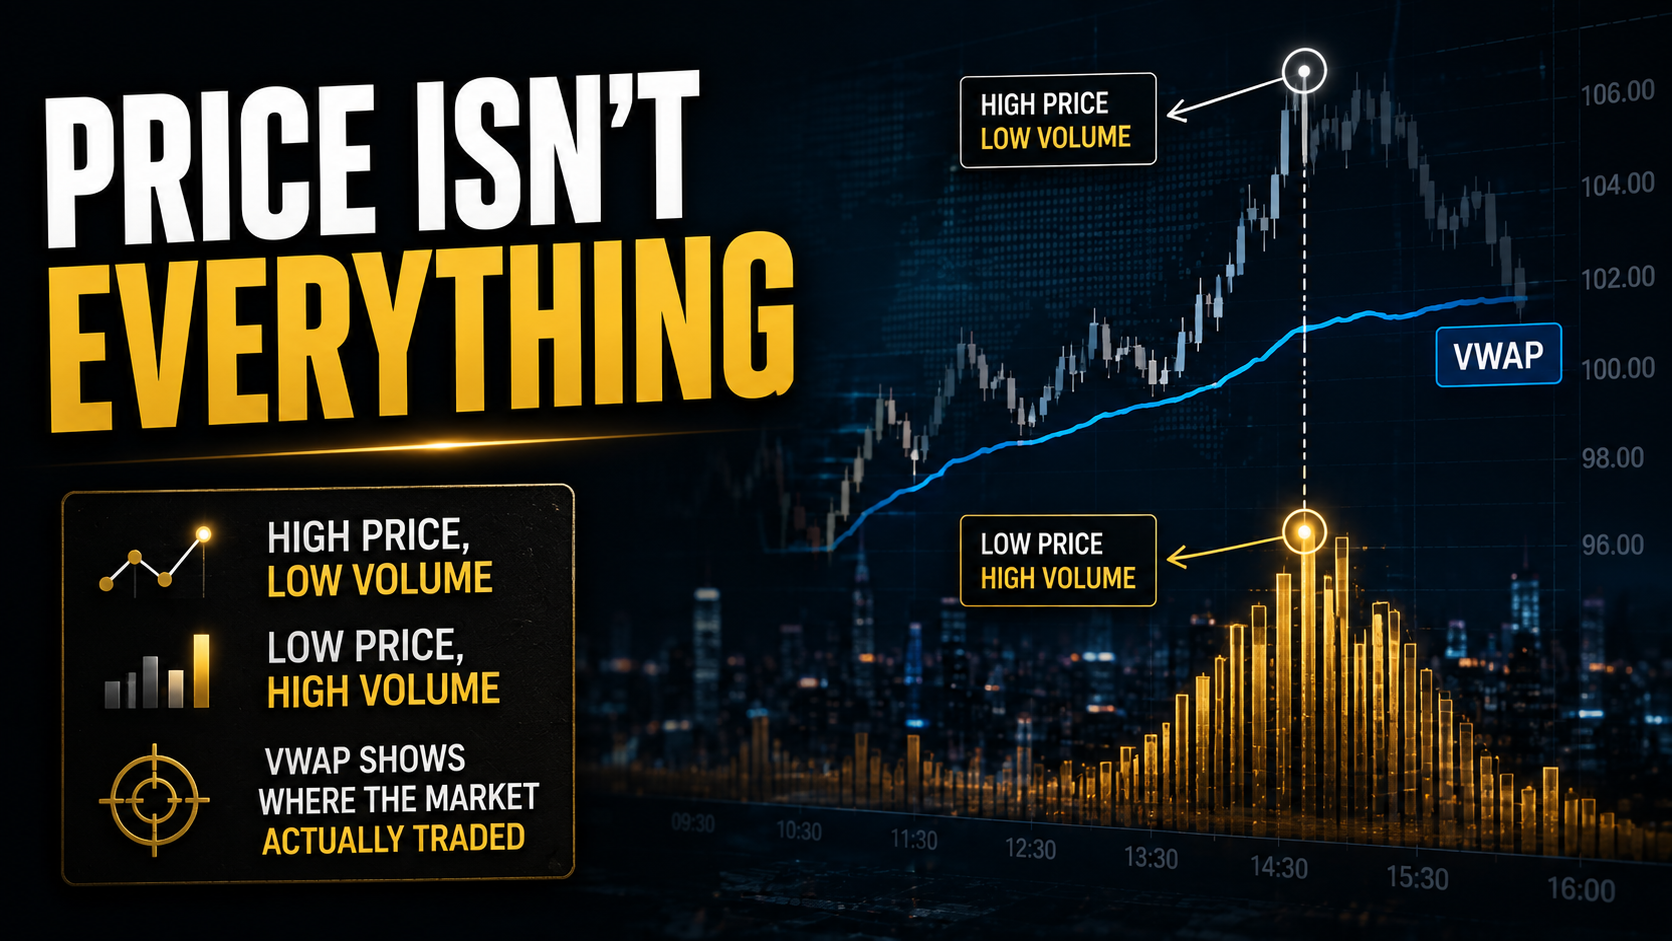
A stock might briefly spike to a new high, but if almost nobody traded there, that price tells us very little about where investors actually committed money.
On the other hand, a price level that attracts millions of shares represents a meaningful consensus between buyers and sellers.
VWAP captures this distinction by incorporating trading volume into its calculation.
Instead of asking "How high did the stock go?", VWAP asks "Where did most investors actually transact?"
That is why professional traders use VWAP to evaluate execution quality, while many retail investors use it to judge whether the current market price is trading above or below the session's average cost.
Ultimately, VWAP is not simply another technical indicator.
It is a practical way to identify where the market has concentrated the greatest amount of capital during a trading session.
How Is VWAP Calculated?
The formula behind VWAP is straightforward.
Multiply each transaction price by its corresponding trading volume, add those values together, and divide by the total trading volume.
The formula can be expressed as
VWAP = Σ (Price × Volume) ÷ Σ Volume
This means prices with heavier trading activity have a much greater influence on the final value.
For example
| Price | Shares Traded |
| $100 | 1,000 |
| $101 | 8,000 |
| $102 | 500 |
Although the stock briefly traded at three different prices, the overwhelming majority of trading occurred around $101.
As a result, VWAP remains close to $101, reflecting where most investors actually bought and sold shares.
This is why VWAP is often described as the market's true average trading price, rather than simply an average of recorded prices.
How Does VWAP Work?
VWAP is typically calculated from the opening bell until the market closes.
Every trade throughout the session continuously updates the calculation.
Because trading volume is relatively light immediately after the market opens, VWAP can move quickly during the first hour of trading.
As the session progresses and more shares are exchanged, the indicator becomes increasingly stable because it reflects a much larger sample of market activity.
For institutional investors, this makes VWAP an ideal benchmark for measuring trading efficiency throughout the day.
VWAP vs. Moving Averages: What's the Difference?
Although many investors compare VWAP with moving averages, the two indicators serve different purposes.
| Feature | VWAP | Moving Average |
| Includes Trading Volume | Yes | No |
| Calculation Period | Current Trading Session | Rolling Historical Period |
| Reset Frequency | Daily | Continuous |
| Primary Users | Institutional Traders | Technical Analysts & Investors |
| Primary Purpose | Measure Average Execution Price | Identify Price Trends |
A moving average helps investors understand trend direction.
VWAP helps investors understand where the market actually traded.
A useful way to think about the difference is this
- Moving averages tell you where the market is heading.
- VWAP tells you where the money has already been.
Both indicators can be valuable, but they answer very different questions.
MasterMind Insight
Markets appear to move because prices change, but prices only change because capital moves.
VWAP helps reveal where that capital has been committed.
Retail investors often focus on price first.
Institutional investors frequently focus on VWAP first—and price second.
Why Do Institutional Investors Rely on VWAP?
VWAP is much more than a technical indicator. On Wall Street, it serves as one of the most widely used benchmarks for measuring trade execution quality.
Large institutions—including mutual funds, pension funds, hedge funds, and investment banks—often need to buy or sell hundreds of thousands, or even millions, of shares.
Executing such a large order all at once would immediately move the market, forcing the institution to pay higher prices when buying or accept lower prices when selling. This phenomenon is known as market impact.
To minimize that impact, institutional traders typically divide large orders into hundreds or thousands of smaller trades throughout the day.
Their goal is not necessarily to buy at the absolute lowest price. Instead, they aim to achieve an average execution price that is close to—or better than—the day's VWAP.
VWAP Execution Algorithms
Many institutional trading desks use VWAP execution algorithms, which automatically spread orders throughout the trading session based on expected market volume.
For example
- Buying below VWAP is generally viewed as better-than-average execution.
- Buying above VWAP may indicate that the trader paid more than the market's average trading price.
This is one reason portfolio managers frequently compare their execution prices against VWAP when evaluating trading performance.
To institutional investors, VWAP is not simply another chart overlay—it is a performance benchmark.

What Is Anchored VWAP?
Traditional VWAP resets at the beginning of every trading session.
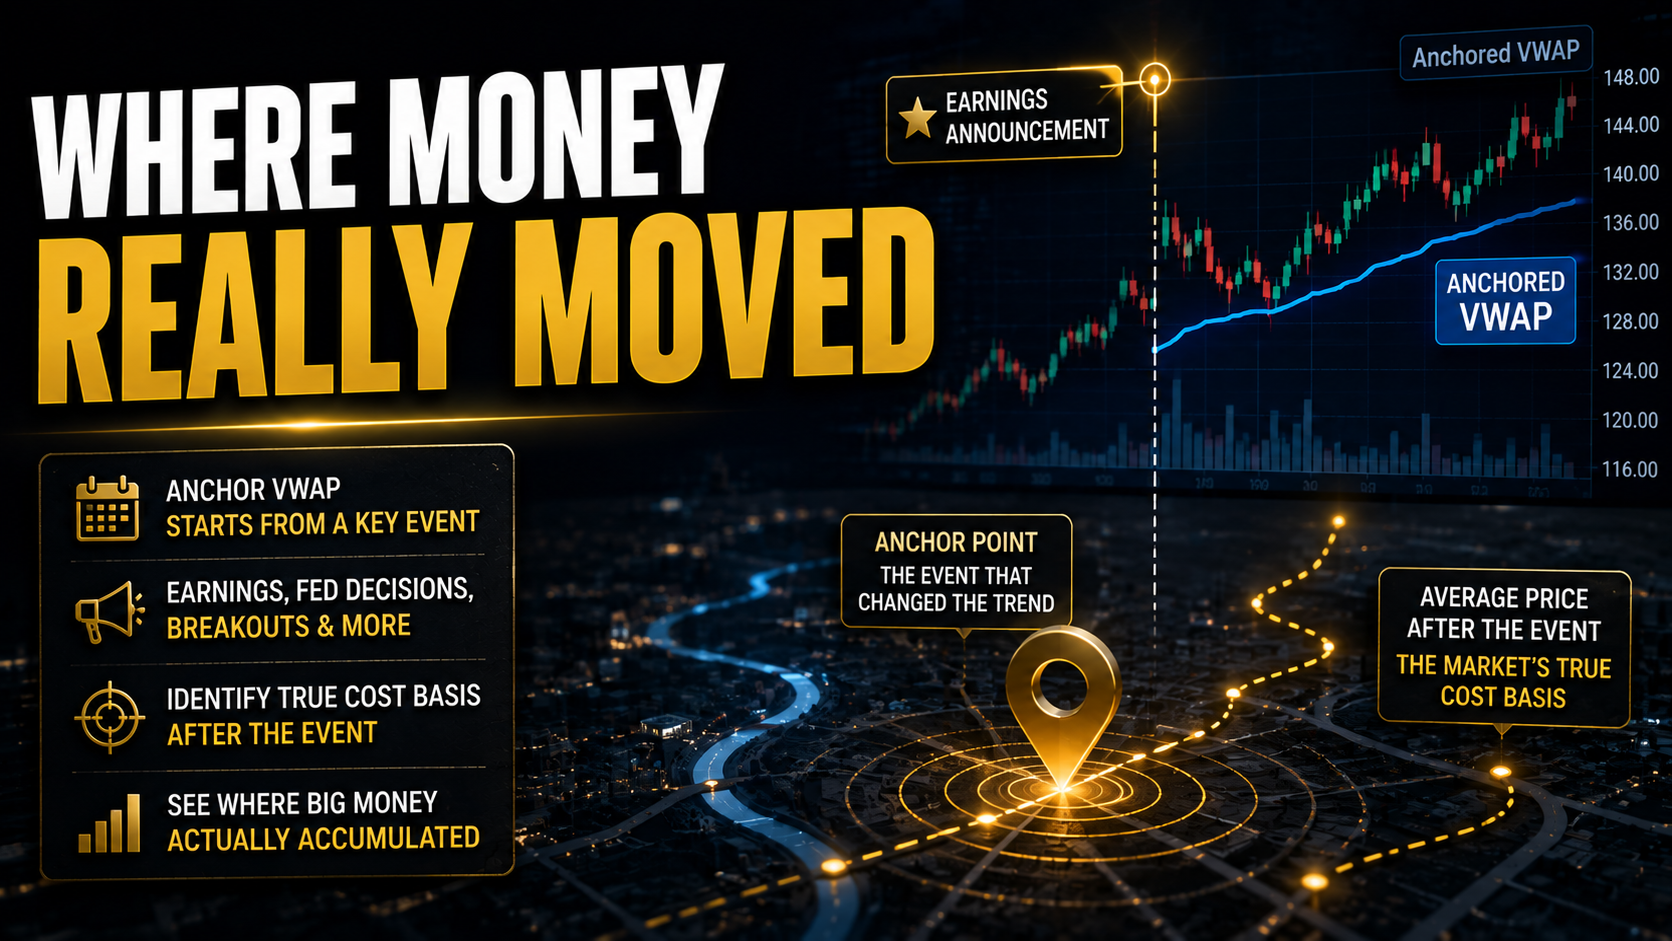
However, many professional traders also use Anchored VWAP, which begins calculating from a specific event rather than from the market open.
Common anchor points include
- Quarterly earnings releases
- Federal Reserve announcements
- Major breakout or breakdown days
- All-time highs or significant market lows
- Mergers, acquisitions, or other major corporate events
For example, if a company reports exceptionally strong earnings, traders may anchor VWAP to the earnings announcement date.
Doing so helps estimate the average cost basis of investors who entered the stock after that event.
Anchored VWAP has become particularly popular among institutional equity traders and is increasingly used in cryptocurrency markets, where investors often anchor calculations to major highs, lows, or regulatory events.
How VWAP Influences Financial Markets
VWAP is widely used across multiple asset classes because it reflects where capital has actually been deployed.
| Asset Class | Common Use of VWAP |
| Stocks | Institutional execution benchmark and intraday support/resistance |
| ETFs | Large order execution and liquidity analysis |
| Futures | Algorithmic trading and order management |
| Bonds | Institutional pricing reference |
| Cryptocurrencies | Anchored VWAP for identifying major accumulation zones |
When a stock trades above VWAP, it indicates that the current market price is above the session's average traded price.
When it trades below VWAP, it suggests that the market is trading beneath the average cost of the day's transactions.
While this alone does not predict future price direction, it provides valuable context for understanding short-term market positioning.
Key Takeaways for Investors
1. VWAP Is Primarily an Intraday Indicator
Standard VWAP begins at the opening bell and resets every trading day.
It is designed to analyze intraday market activity, not to estimate a company's intrinsic value or long-term investment potential.
2. Always Consider Trading Volume
A move above or below VWAP becomes more meaningful when accompanied by increased trading volume.
Without meaningful participation, price movements may lack conviction.
Since VWAP itself is volume-weighted, combining it with volume analysis provides stronger insight than using either metric alone.
3. Combine VWAP With Other Indicators
VWAP identifies where the market has traded.
Moving averages identify trend direction.
Fundamental analysis evaluates business quality.
Each serves a different purpose, and no single indicator should be used in isolation.
4. VWAP Does Not Predict the Future
One of the biggest misconceptions among newer investors is believing that trading above VWAP automatically signals a bullish market.
VWAP is descriptive—not predictive.
It tells you where trading activity has occurred, not where prices must go next.
Successful investing requires combining VWAP with broader market context, company fundamentals, macroeconomic conditions, and risk management.
What Does Smart Money See?
Most retail investors focus on price.
Professional investors focus on capital allocation.
Rather than asking whether a stock is up or down today, institutional investors often ask
- Where is the market's average cost basis?
- Are institutions accumulating shares or distributing them?
- Is today's move supported by genuine trading volume?
- Is capital rotating into or out of this sector?
- Does today's price action improve or weaken the long-term risk/reward profile?
These questions reveal an important truth
Markets are driven by capital flows—not headlines.
Price is simply the visible result of money changing hands.
VWAP helps investors identify where that money has actually been committed.
Before entering any position, consider asking yourself
Am I buying near the market's average cost, or am I providing liquidity to investors who bought much earlier?
That single question can often encourage more disciplined decision-making.

Conclusion
VWAP (Volume-Weighted Average Price) is far more than another line on a trading chart.
It represents the average price at which the market has actually traded, adjusted for the amount of capital exchanged at each price level.
For institutional investors, VWAP serves as a benchmark for measuring execution quality.
For individual investors, it provides valuable context about where the market's average cost basis lies during the trading session.
While VWAP should never be used as a standalone trading signal, it becomes a powerful analytical tool when combined with trend analysis, trading volume, and fundamental research.
Ultimately, successful investing is not about predicting every price movement.
It is about understanding where capital is flowing, managing risk effectively, and making disciplined decisions over the long term.
Remember this: Price is the outcome. Volume reflects conviction. VWAP reveals where that conviction was strongest.
This was MasterMind.
'[Global] Success Blueprints' 카테고리의 다른 글