What Is Market Breadth? How It Reveals the Real Strength of the Stock Market


Hello, this is MasterMind.
The S&P 500 keeps making new highs, yet your portfolio barely moves. Sound familiar?
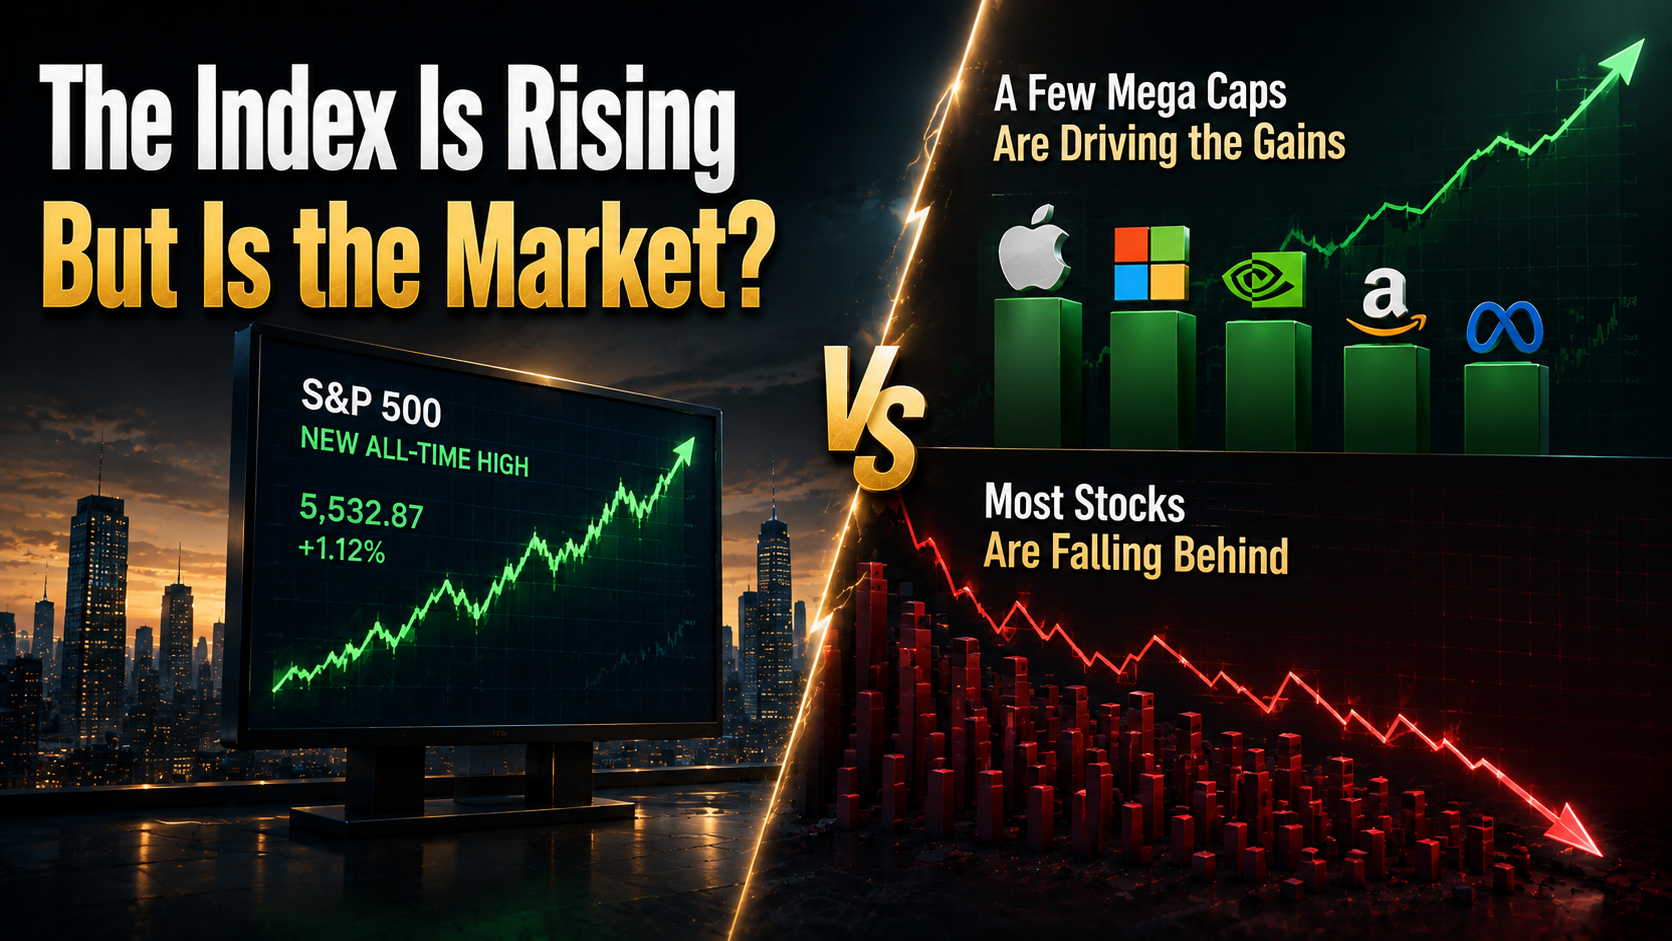
Many investors assume a rising index means the entire stock market is healthy. In reality, that isn't always true. There are periods when only a handful of mega-cap companies—such as Apple, Microsoft, NVIDIA, Amazon, and Meta—are responsible for most of the market's gains, while hundreds of other stocks struggle or even decline.
This creates an important question
Is the market truly getting stronger, or are only a few stocks making it look that way?
Professional investors answer that question with one of the most valuable market health indicators available: Market Breadth.
Rather than focusing solely on where an index is trading, Market Breadth reveals how many stocks are actually participating in the trend. It provides insight into the quality, sustainability, and internal strength of a rally—information that price indexes alone cannot provide.

Key Takeaway
Market Breadth measures how broadly a market's gains or losses are shared across individual stocks, making it one of the most important indicators of market health and the sustainability of long-term trends.
What Is Market Breadth?
Market Breadth refers to the degree of participation among individual stocks during a market advance or decline.
Instead of asking,
"Is the S&P 500 rising?"
Market Breadth asks,
"How many stocks are actually rising?"
This distinction is critical because most major U.S. indexes—including the S&P 500 and Nasdaq-100—are market-cap weighted.
That means larger companies have a much greater influence on index performance than smaller companies.
For example, if NVIDIA, Microsoft, Apple, Amazon, and Meta rally sharply, they can push the entire S&P 500 higher even if hundreds of other companies are declining.
In other words,
a rising index does not necessarily mean a healthy market.
Think of It Like a Sports Team
Imagine a basketball team where only one superstar scores all the points while every other player struggles.
The team may still win a few games, but it is far less resilient than a team where every player contributes.
The stock market works the same way.
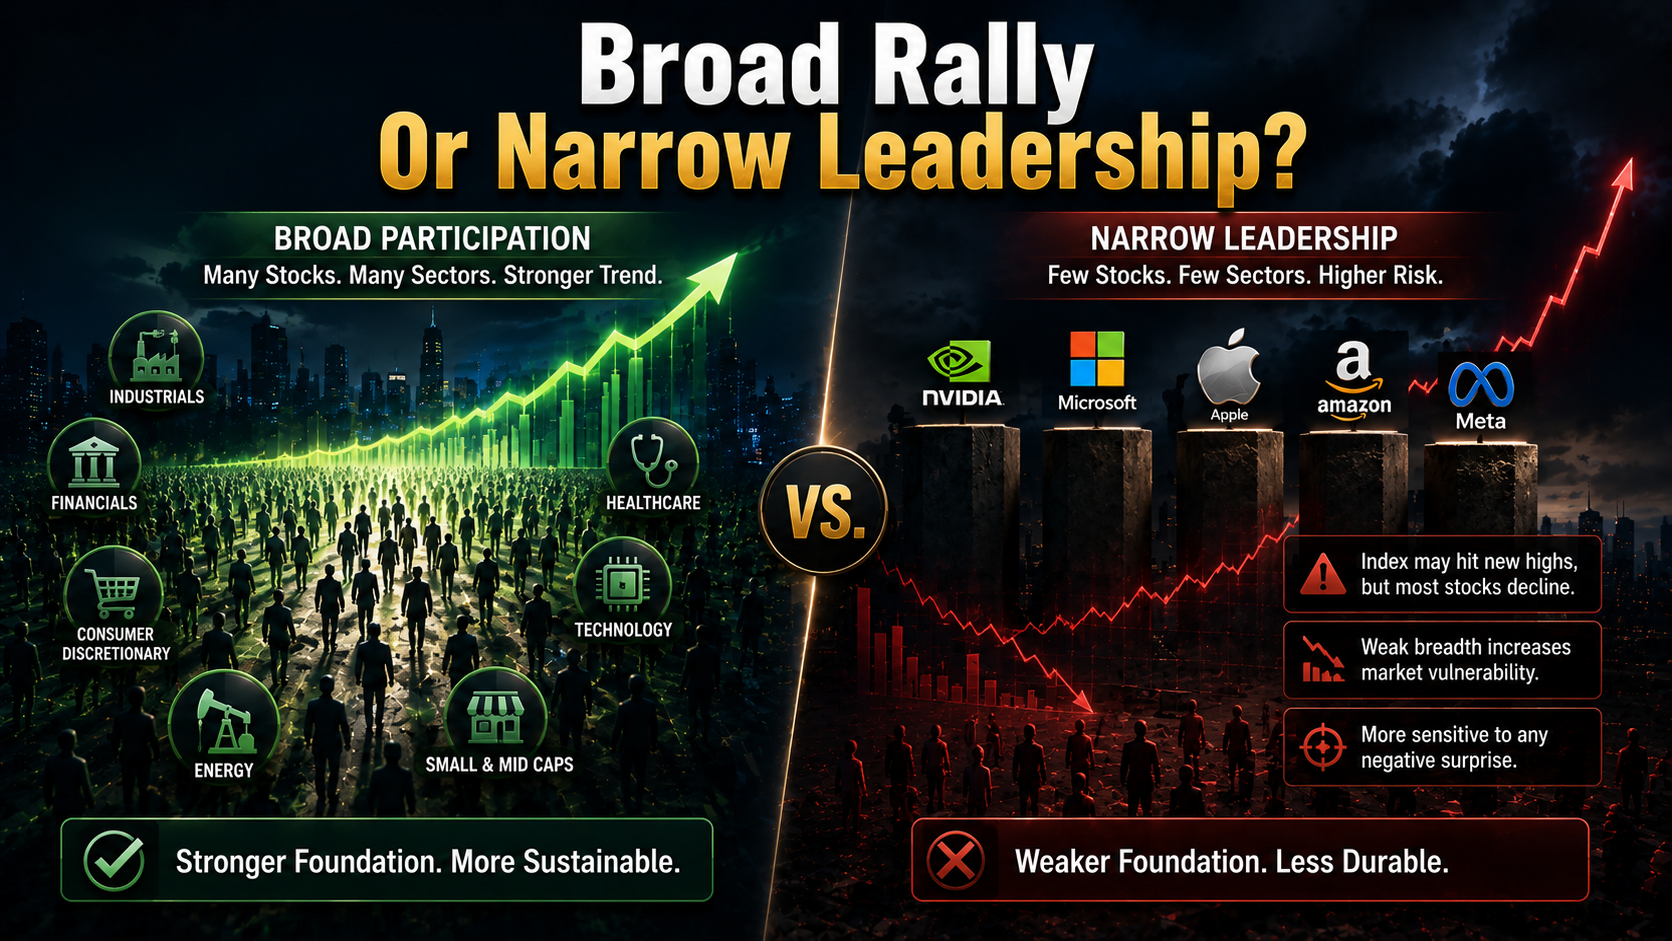
A rally driven by hundreds of companies across multiple sectors is generally stronger than one carried by only a handful of mega-cap stocks.
Market Breadth helps investors distinguish between those two situations.
Why Indexes Can Be Misleading
Most investors follow headlines like
- "The S&P 500 Hits Another Record High"
- "Nasdaq Surges on AI Optimism"
- "Stocks Reach New Highs"
While these headlines are technically correct, they don't necessarily describe what's happening beneath the surface.
Consider two different scenarios.
Scenario A: Healthy Bull Market
- Technology stocks rise.
- Industrials rise.
- Financials participate.
- Healthcare joins the rally.
- Small-cap stocks strengthen.
- Mid-cap companies also trend higher.
This represents broad participation.
Money is flowing throughout the market.
Scenario B: Narrow Leadership
- NVIDIA jumps 8%.
- Microsoft rises 4%.
- Apple gains 3%.
Meanwhile,
- Most industrial stocks fall.
- Small caps underperform.
- Regional banks decline.
- Consumer discretionary weakens.
The S&P 500 may still finish the day higher because its largest companies carry enormous weight.
However, Market Breadth would reveal a much weaker picture.
This is why experienced investors rarely judge market strength by the index alone.
How Market Breadth Is Measured
There is no single Market Breadth indicator.
Instead, investors combine several measurements to evaluate the market's internal strength.
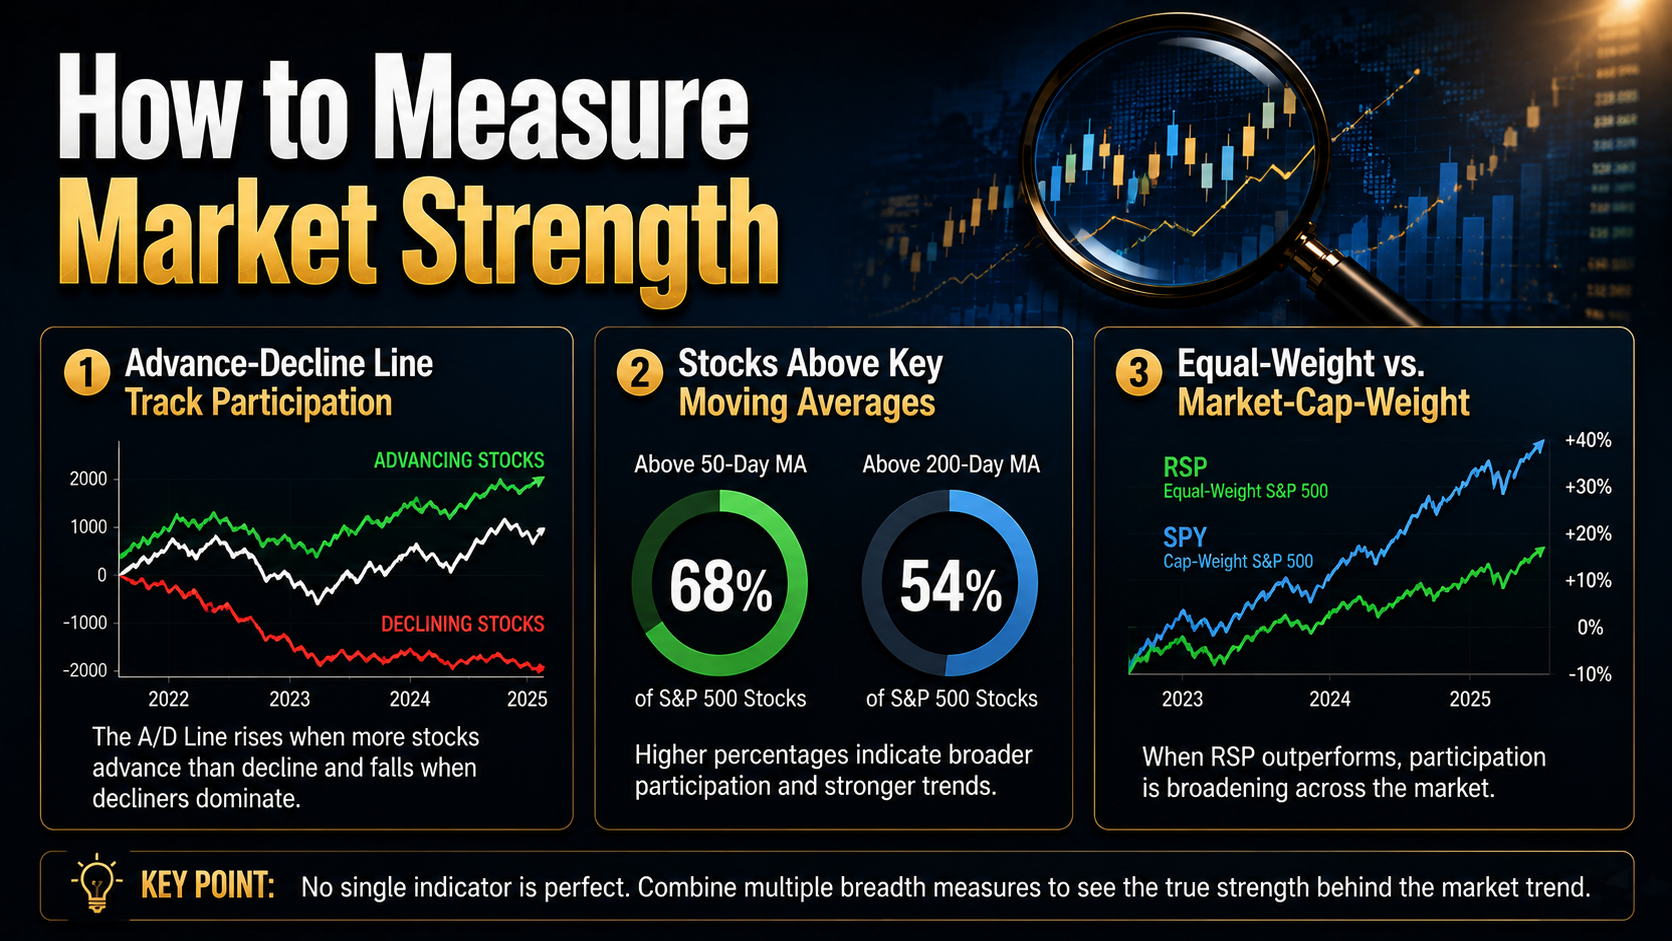
1. Advance-Decline Line (A/D Line)
The Advance-Decline Line is one of the oldest and most respected breadth indicators.
It tracks the cumulative difference between
- Advancing stocks
- Declining stocks
If more stocks rise than fall, the A/D Line moves higher.
If more stocks decline, it moves lower.
One of the most important signals occurs when the index continues climbing while the A/D Line weakens.
This is known as a breadth divergence.
It suggests that fewer stocks are supporting the rally, even though the headline index continues making new highs.
Historically, many major market tops have been preceded by weakening breadth rather than immediate price declines.
2. Percentage of Stocks Above Key Moving Averages
Another popular measurement looks at how many stocks remain above important moving averages such as
- 50-day moving average
- 200-day moving average
For example
- If 80% of S&P 500 stocks remain above their 200-day moving averages, market participation is generally considered healthy.
- If the index reaches a new high while only 40% of stocks remain above their long-term trend, leadership may be becoming increasingly concentrated.
This helps investors judge whether momentum is broad or narrow.
3. Equal-Weight vs. Market-Cap-Weighted Indexes
One of the easiest ways to evaluate Market Breadth is by comparing
- SPY (market-cap weighted S&P 500 ETF)
- RSP (equal-weight S&P 500 ETF)
SPY gives much larger weights to companies such as Apple, Microsoft, and NVIDIA.
RSP gives every company the same weight regardless of size.
If SPY consistently outperforms RSP, it often indicates that only the largest companies are driving market gains.
Conversely, when RSP begins outperforming, it usually signals that participation is expanding across the broader market—a healthier sign for long-term investors.
Why Market Breadth Matters
Market Breadth is important because markets often weaken internally long before prices begin to fall.
Price is the final result.
Breadth reveals the process taking place underneath.
Professional investors know that market structure usually changes before market direction changes.
As liquidity begins concentrating in fewer stocks, the market's internal foundation can gradually weaken even while major indexes continue rising.
Understanding that difference helps investors avoid confusing a strong index with a strong market.
In investing, recognizing changes in market quality is often more valuable than simply following market prices.
Why Market Breadth Matters to Investors
Market Breadth does not predict every correction or market top. A narrow market can remain narrow for a long time, especially when a small group of dominant companies continues producing strong earnings and attracting global capital.
However, weakening breadth can tell investors that the market is becoming more dependent on fewer stocks.
That matters because a market supported by only a handful of companies has less room for error.
If expectations for those leaders begin to fall, there may not be enough strength elsewhere to support the broader index.
1. Market Breadth Can Reveal Changes Before the Index
Major indexes often hide weakness during the late stages of a rally.
The S&P 500 may continue reaching new highs because its largest components remain strong. At the same time, smaller companies, cyclical sectors, and lower-quality stocks may already be declining.
This creates a divergence between the index and the broader market.
A weakening Advance-Decline Line, falling participation above the 200-day moving average, or sustained underperformance by the equal-weight S&P 500 can indicate that the rally is losing support.
This does not guarantee an immediate decline.
It does suggest that the market is becoming increasingly fragile.
Markets often change internally before they change visibly.
2. Market Breadth Shows Where Liquidity Is Moving
Stock prices do not rise simply because investors become more optimistic. Prices rise because capital moves into assets faster than sellers are willing to supply them.
When liquidity is abundant, money often spreads across
- Mega-cap technology stocks
- Industrials
- Financials
- Healthcare
- Consumer discretionary companies
- Small-cap and mid-cap stocks
This creates broad participation.
When liquidity becomes more selective, investors may concentrate capital in companies perceived as the safest, most profitable, or most strategically important.
In the U.S. market, this often means money moves toward businesses with
- Strong free cash flow
- High profit margins
- Durable competitive advantages
- Large cash reserves
- Dominant positions in structural growth industries
The index may remain strong, but weakening breadth can reveal that investors are becoming more cautious beneath the surface.
3. Market Breadth Helps Explain Why Many Portfolios Underperform
Investors often feel confused when the S&P 500 is rising but their individual stocks are not.
Market Breadth frequently explains the gap.
When leadership is narrow, investors who do not own the small group of index leaders may experience weak or negative returns even during a headline bull market.
The difference becomes especially important for investors holding
- Small-cap stocks
- Equal-weight portfolios
- Value stocks
- Regional banks
- Unprofitable growth companies
- Sector-specific positions
A rising market-cap-weighted index can therefore coexist with poor performance across a large portion of the market.
This is not necessarily evidence that an investor selected the wrong stocks. It may reflect a market environment in which capital is concentrated in only a few areas.
How Market Breadth Affects Major Asset Classes
Market Breadth is primarily a stock market concept, but changes in participation can also provide clues about broader risk appetite and liquidity conditions.
| Asset Class | Broad Market Participation | Narrow Market Participation |
| U.S. stocks | More sectors and companies join the rally, improving trend resilience | Gains depend heavily on a few mega-cap leaders |
| Small caps | Often benefit as capital moves toward higher-risk areas | Usually underperform when investors prefer liquidity and quality |
| Treasuries | Strong economic expectations may place upward pressure on yields | Risk aversion may increase demand for government bonds |
| U.S. dollar | May soften when global risk appetite expands | May strengthen during global risk reduction |
| Gold | Can face competition from risk assets during broad rallies | May benefit from uncertainty, falling confidence, or defensive demand |
| Bitcoin | Can benefit when speculative liquidity expands | May become more volatile when liquidity narrows |
| Altcoins | Often participate during strong, broad risk-on phases | Frequently lose liquidity when investors retreat toward Bitcoin or cash |
These relationships are not mechanical rules.
Interest rates, inflation expectations, Federal Reserve policy, earnings growth, and geopolitical risk can produce different outcomes.
Market Breadth should therefore be used as a contextual indicator rather than a standalone trading signal.
Market Breadth and Sector Rotation
A healthy market does not require every stock to rise at the same time.
Leadership naturally rotates between sectors.
For example, a rally may begin with large technology companies and later expand into
- Industrials
- Financials
- Energy
- Healthcare
- Consumer discretionary
- Small-cap stocks
This expansion is often a positive sign because it suggests that capital is finding opportunities beyond the original leaders.
However, investors should distinguish between genuine broadening and temporary rotation.
A sustainable broadening phase usually includes
- Rising numbers of advancing stocks
- Improving equal-weight index performance
- More stocks reaching new 52-week highs
- Greater participation above long-term moving averages
- Strength across several economically sensitive sectors
If one sector rises only because another is collapsing, overall market breadth may not actually be improving.
The key question is not whether leadership changes, but whether more capital is participating in the advance.
What Investors Should Watch
1. Compare the S&P 500 With the Equal-Weight S&P 500
Comparing SPY and RSP offers a simple view of market concentration.
When SPY strongly outperforms RSP, mega-cap companies are likely carrying a disproportionate share of the market.
When RSP begins to strengthen relative to SPY, participation may be broadening.
This comparison is particularly useful during periods dominated by artificial intelligence, cloud computing, semiconductor, or mega-cap growth narratives.
2. Follow the Advance-Decline Line
The A/D Line helps determine whether more stocks are joining or leaving the rally.
A rising index combined with a rising A/D Line generally confirms the trend.
A rising index combined with a falling A/D Line may indicate weakening internal support.
Investors should focus on sustained trends rather than a single trading session.
3. Monitor Stocks Above the 50-Day and 200-Day Moving Averages
The percentage of stocks above the 50-day moving average can reflect short- to medium-term participation.
The percentage above the 200-day moving average provides a longer-term view of market health.
The exact percentage should not be treated as an automatic buy or sell signal. What matters more is whether participation is improving or deteriorating over time.
4. Watch New Highs and New Lows
A healthy market advance usually produces an expanding number of new highs.
If the index reaches record levels while fewer stocks make new highs, the rally may be becoming increasingly dependent on a narrow group of leaders.
A rising number of new lows can also indicate that weakness is spreading beneath the index.
5. Consider Trading Volume
Broad participation supported by healthy volume is generally more convincing than a rally occurring with declining activity.
Volume helps reveal whether institutional capital is supporting the move.
Breadth and volume together can provide a clearer picture than either indicator alone.
How Professional Investors Use Market Breadth
Professional investors rarely treat Market Breadth as a precise timing tool.
Instead, they use it to assess the quality of the market environment.
A broad market can justify greater exposure to cyclical sectors, smaller companies, and higher-beta assets.
A narrow market may encourage investors to focus more heavily on
- Balance-sheet strength
- Cash-flow durability
- Liquidity
- Earnings visibility
- Position sizing
- Diversification
- Downside protection
The objective is not to predict the exact day a rally will end.
The objective is to understand how much risk is hiding beneath the index.
What Do Wealthy Investors Look for in Market Breadth?
Experienced investors tend to focus less on headlines and more on capital flows, financial resilience, and long-term survival.
1. Where Is the Money Moving?
A rising index tells investors that prices increased.
Market Breadth helps explain where the money went.
If capital is flowing into hundreds of companies across several sectors, the market may be supported by improving economic expectations and expanding liquidity.
If capital is concentrating in only a few mega-cap companies, investors may be seeking safety, earnings certainty, or exposure to a dominant long-term theme.
The same index return can therefore reflect two completely different market environments.
2. Which Businesses Can Survive a Liquidity Withdrawal?
When breadth narrows, liquidity often becomes more valuable.
Companies with weak balance sheets, negative free cash flow, or heavy refinancing needs may struggle when investors become selective.
Businesses with strong cash generation and manageable debt are generally better positioned to survive periods of market stress.
This is why wealthy investors often evaluate market breadth alongside company fundamentals.
They are not only asking which stock can rise the fastest.
They are asking which asset can remain financially durable when capital becomes scarce.
3. Is the Portfolio Dependent on One Market Narrative?
A narrow rally can create strong returns for investors concentrated in the leading theme.
It can also create hidden vulnerability.
If a portfolio depends heavily on AI spending, semiconductor demand, falling interest rates, or one group of mega-cap stocks, a change in expectations may affect many positions simultaneously.
Diversification should therefore be evaluated by economic exposure, not simply by the number of holdings.
Owning ten companies linked to the same narrative is not necessarily true diversification.
4. Is the Market Offering Opportunity or Creating FOMO?
When a small number of stocks rise rapidly, investors often feel pressure to chase them.
Professional investors are more likely to ask whether the price already reflects exceptionally high expectations.
They may rebalance gradually rather than make an all-or-nothing decision.
The goal is not to abandon strong companies simply because they have performed well. It is to avoid allowing recent performance to replace disciplined valuation and risk management.

Questions Investors Should Ask Themselves
- Is the current rally supported by many stocks or only a few?
- Is equal-weight performance improving or deteriorating?
- Are small-cap and cyclical stocks beginning to participate?
- Is my portfolio too dependent on one sector or market narrative?
- Are the companies I own supported by real cash flow?
- Would my portfolio remain resilient if the largest index leaders stopped rising?
- Am I reacting to market strength, or chasing it after expectations have already become extreme?
These questions do not provide certainty.
They help investors recognize the type of market they are operating in.
Limitations of Market Breadth
Market Breadth is valuable, but it has several limitations.
Narrow Breadth Can Persist
A concentrated market can continue rising for months or even years when dominant companies deliver strong earnings and absorb a growing share of economic profits.
Weak breadth does not automatically mean an immediate market crash.
Different Indicators Can Send Different Signals
The A/D Line may improve while small caps remain weak.
The percentage of stocks above the 200-day moving average may rise while new highs remain limited.
Investors should avoid relying on one indicator alone.
Index Composition Matters
Breadth measurements can vary depending on whether investors examine
- The New York Stock Exchange
- The Nasdaq
- The S&P 500
- The Russell 2000
- All U.S.-listed stocks
Each universe contains different types of companies and may produce different signals.
Breadth Does Not Replace Fundamental Analysis
Market Breadth measures participation, not valuation or business quality.
A broad rally can still become overvalued.
A narrow rally can still be supported by exceptional earnings growth.
Breadth should complement analysis of earnings, interest rates, liquidity, and valuation rather than replace it.
Final Takeaway
Market Breadth helps investors see beyond the headline index.
The S&P 500 can reach new highs while much of the market remains weak. It can also appear stagnant while participation is quietly improving beneath the surface.
That is why Market Breadth matters.
It reveals whether a trend is being supported by a broad range of companies or carried by a small group of dominant stocks.
The index shows the result, but Market Breadth shows how that result was created.
Long-term investors do not need to predict every market turn. They need to understand whether liquidity is expanding or concentrating, whether earnings strength is spreading or narrowing, and whether their portfolios can survive when leadership changes.
In investing, prediction may attract attention, but survival creates lasting results.
This has been MasterMind.
'[Global] Success Blueprints' 카테고리의 다른 글