What Is Market Breadth? Why It Matters and How to Measure the Stock Market's Real Strength


Hello, this is MasterMind.
Have you ever looked at the S&P 500 hitting a new all-time high while your own portfolio barely moved—or even declined?
It happens more often than many investors realize.
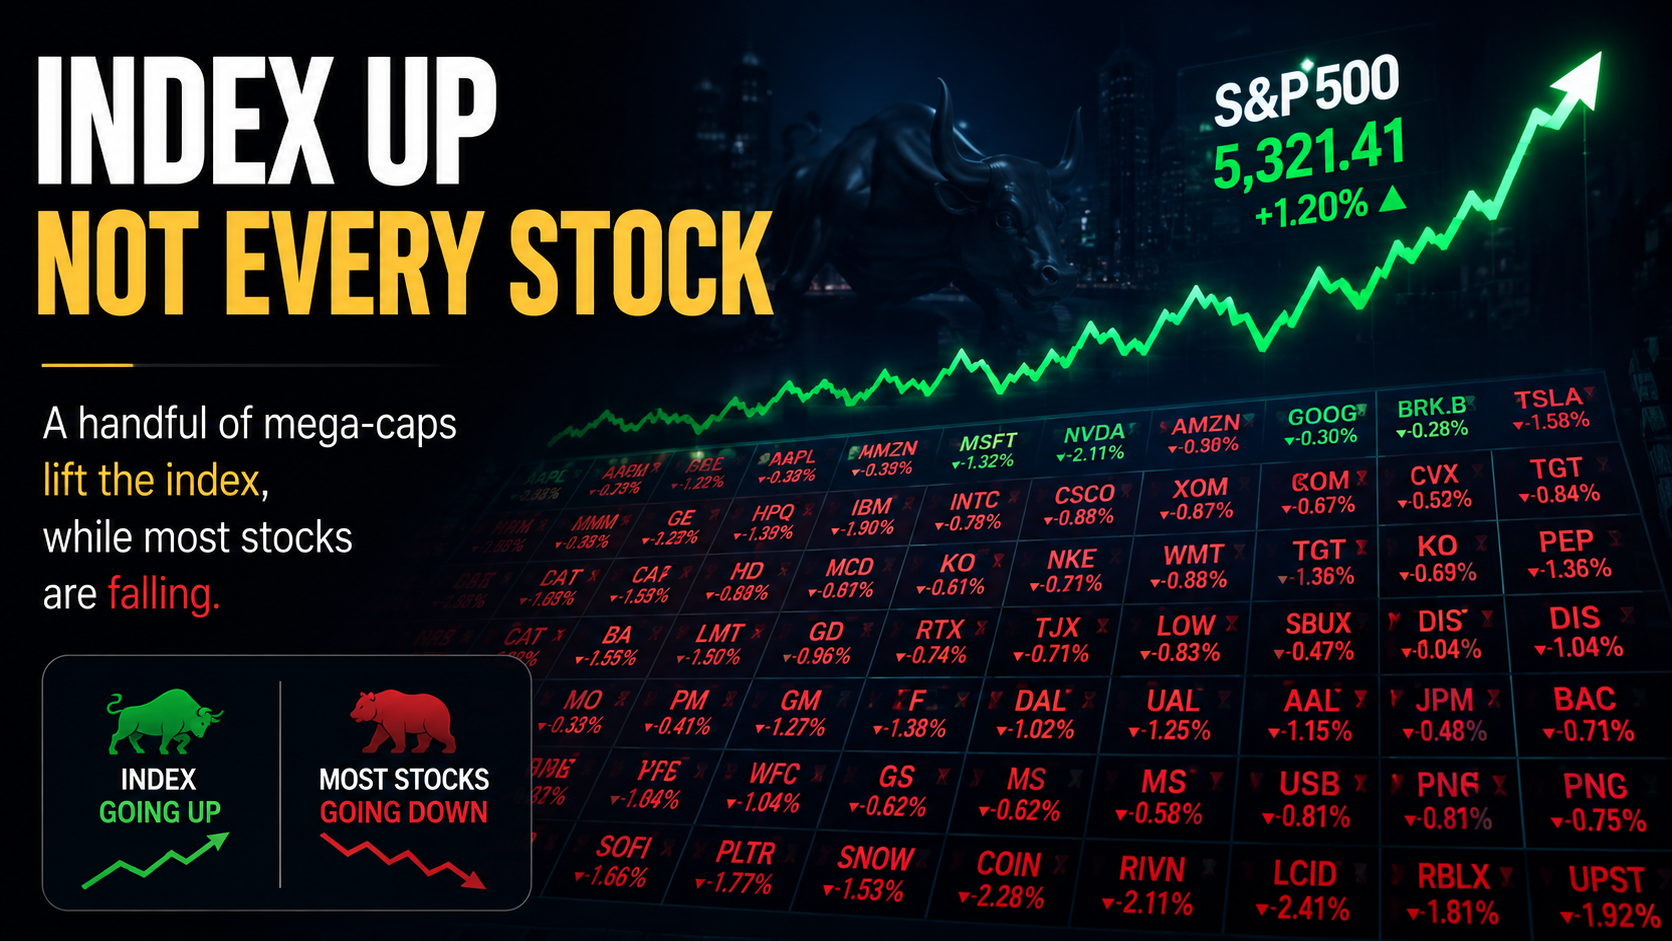
A major stock index can climb because a handful of mega-cap companies are surging, while hundreds of other stocks quietly struggle beneath the surface.
This gap between what the index shows and what the broader market is actually doing is exactly why investors pay attention to Market Breadth.
Professional investors rarely judge a market by index performance alone. They also look at market breadth to determine whether a rally is broad-based and healthy or being driven by only a small group of stocks.
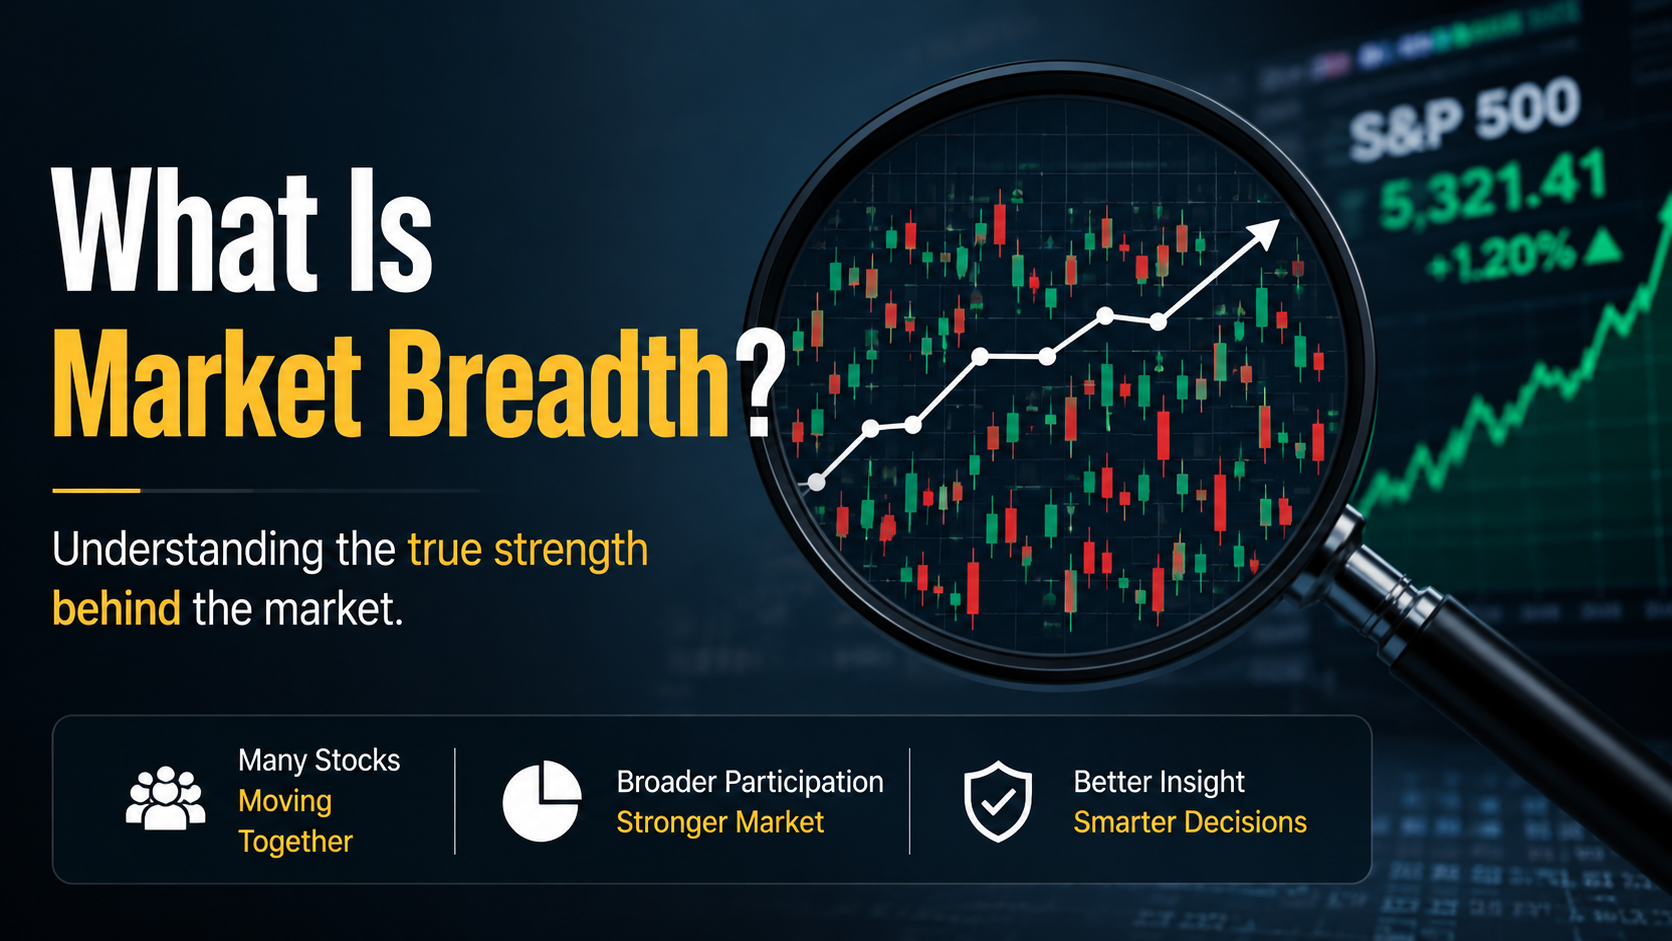
Key Takeaway
Market Breadth measures how many stocks participate in a market move, helping investors distinguish between a healthy bull market and an index rally supported by only a few large companies.
What Is Market Breadth?
Market Breadth refers to the overall participation of stocks in a market trend.
Rather than asking, "Is the S&P 500 going up?", Market Breadth asks a more important question
"How many stocks are actually contributing to that move?"
Imagine a football team winning every game because one superstar scores all the goals.
The team appears successful, but its overall performance may not be nearly as strong as the results suggest.
Now compare that to a team where nearly every player contributes.
Both teams are winning—but one has a much healthier foundation.
The stock market works in a similar way.
An index measures overall performance, but it doesn't reveal whether the gains are being supported by hundreds of companies or only a handful of mega-cap stocks.
Market Breadth helps investors see what is happening beneath the surface.
How Is Market Breadth Measured?
Investors use several indicators to evaluate Market Breadth.
The most common include
| Indicator | What It Measures |
| Advance-Decline (A/D) Line | Difference between advancing and declining stocks |
| Advance-Decline Ratio | Number of advancing stocks versus declining stocks |
| New Highs vs. New Lows | Stocks making new 52-week highs and lows |
| Percentage Above Moving Averages | Portion of stocks trading above the 50-day or 200-day moving average |
| McClellan Oscillator | Internal market momentum |
Among these, the Advance-Decline Line remains one of the most widely followed indicators.

The Advance-Decline (A/D) Line
The A/D Line tracks the cumulative difference between stocks that close higher and those that close lower each trading day.
For example
- 420 advancing stocks
- 80 declining stocks
This suggests that buying interest is broad and healthy.
On the other hand
- 120 advancing stocks
- 380 declining stocks
while the S&P 500 still rises often means that only a few large-cap companies are carrying the index higher.
In general
- Index rising + A/D Line rising = Healthy market
- Index rising + A/D Line falling = Weakening market participation
This difference is known as Breadth Divergence, and it is closely monitored by institutional investors.
Stocks Above the 50-Day and 200-Day Moving Average
Another popular way to evaluate Market Breadth is by measuring how many stocks remain above key moving averages.
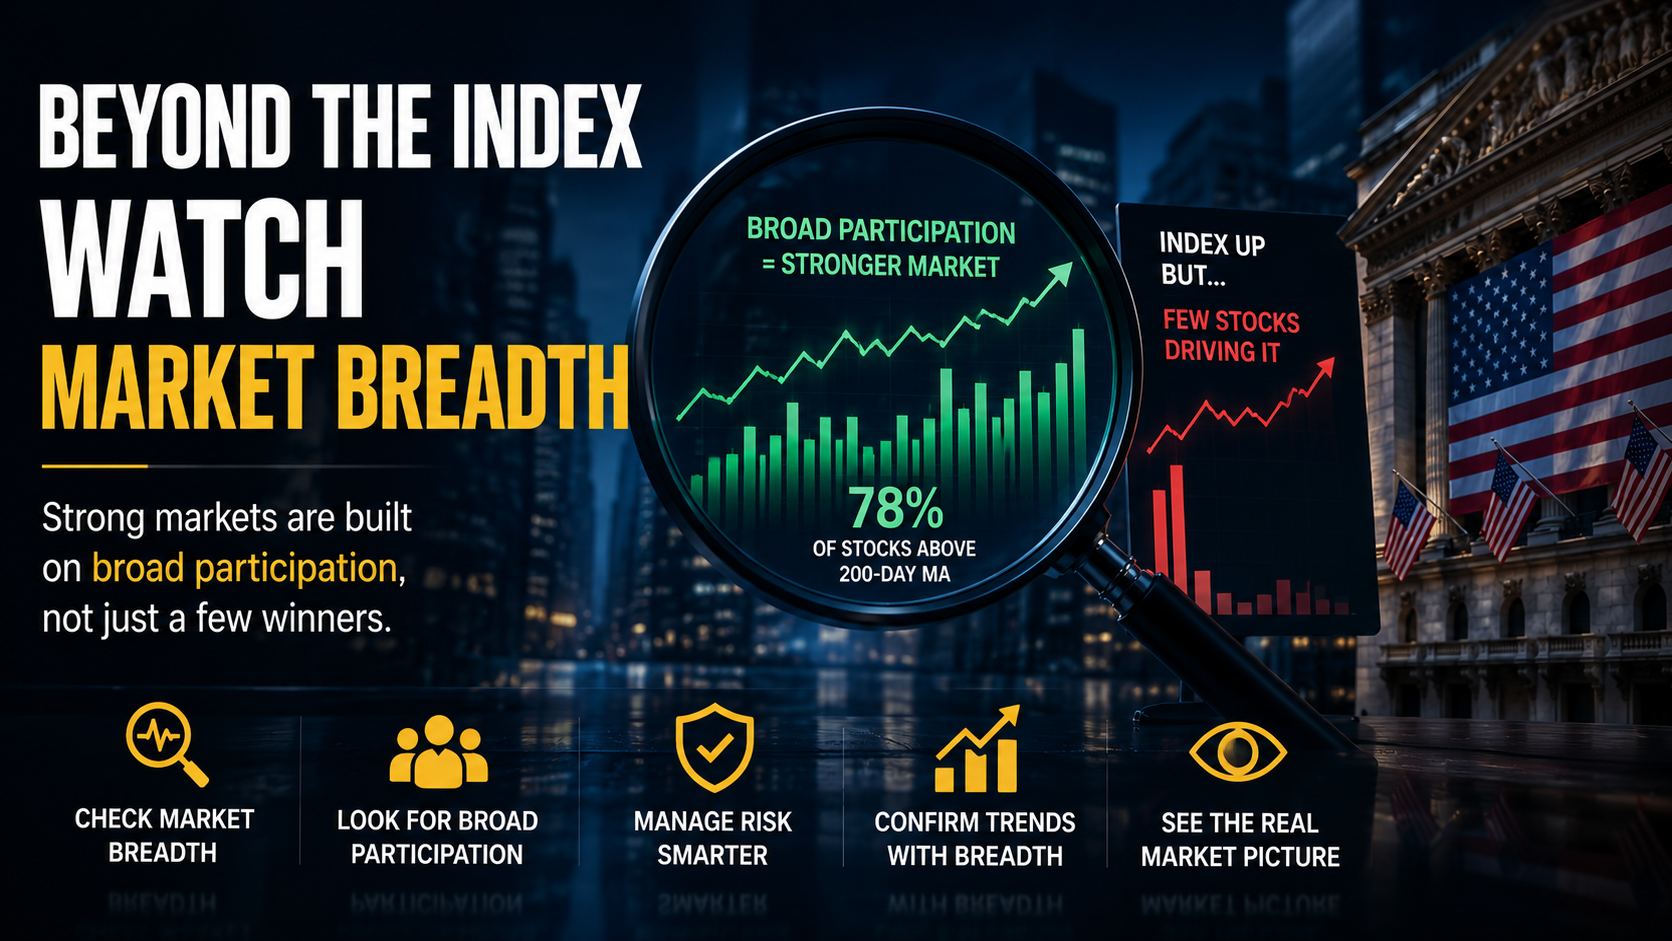
If 80% of stocks trade above their 200-day moving average, market participation is generally considered broad and healthy.
If the index reaches new highs while fewer than half of its components remain above their long-term moving averages, the rally may be losing strength beneath the surface.
This is one reason experienced investors rarely rely on index performance alone.
Breadth Expansion vs. Breadth Contraction
Market Breadth generally moves through two broad phases.
Breadth Expansion
Breadth Expansion occurs when more and more stocks begin participating in a rally.
A healthy bull market often starts with large-cap stocks before expanding into
- Mid-cap companies
- Small-cap stocks
- Value stocks
- Cyclical sectors
As participation broadens, the rally becomes increasingly sustainable because capital is flowing throughout the market rather than concentrating in only a few companies.
Breadth Contraction
Breadth Contraction is the opposite.
The index may continue climbing, but fewer stocks contribute to the advance.
This often reflects growing caution among investors, with capital flowing primarily into perceived market leaders rather than the broader market.
While Breadth Contraction does not predict an immediate market decline, it can signal that the market's internal strength is weakening.
Understanding this distinction allows investors to evaluate not just whether the market is rising, but how healthy that rise actually is.
Why Market Breadth Matters
One of the most dangerous moments in investing is when the market appears strongest.
History has shown that major indexes can continue making new highs even as fewer and fewer stocks participate in the rally.
This is why professional investors pay close attention to Breadth Divergence.
When investors become more cautious, capital often flows into a small group of high-quality, highly liquid companies instead of the broader market.
In recent years, the Magnificent Seven have occasionally accounted for a significant share of the S&P 500's gains. While these companies have delivered exceptional performance, periods in which only a handful of stocks drive the index can make the overall market appear stronger than it actually is.
That doesn't automatically mean a correction is imminent.
However, it does suggest investors should look beyond headline index returns and examine the market's internal health.
Market insight: Indexes measure performance. Market Breadth measures participation. Long-term investors benefit from understanding both.
A Real-World Example
A healthy bull market usually begins with leadership from large-cap stocks.
As confidence improves, buying gradually spreads into
- Mid-cap companies
- Small-cap stocks
- Value stocks
- Cyclical industries
This broad participation is often referred to as Breadth Expansion.
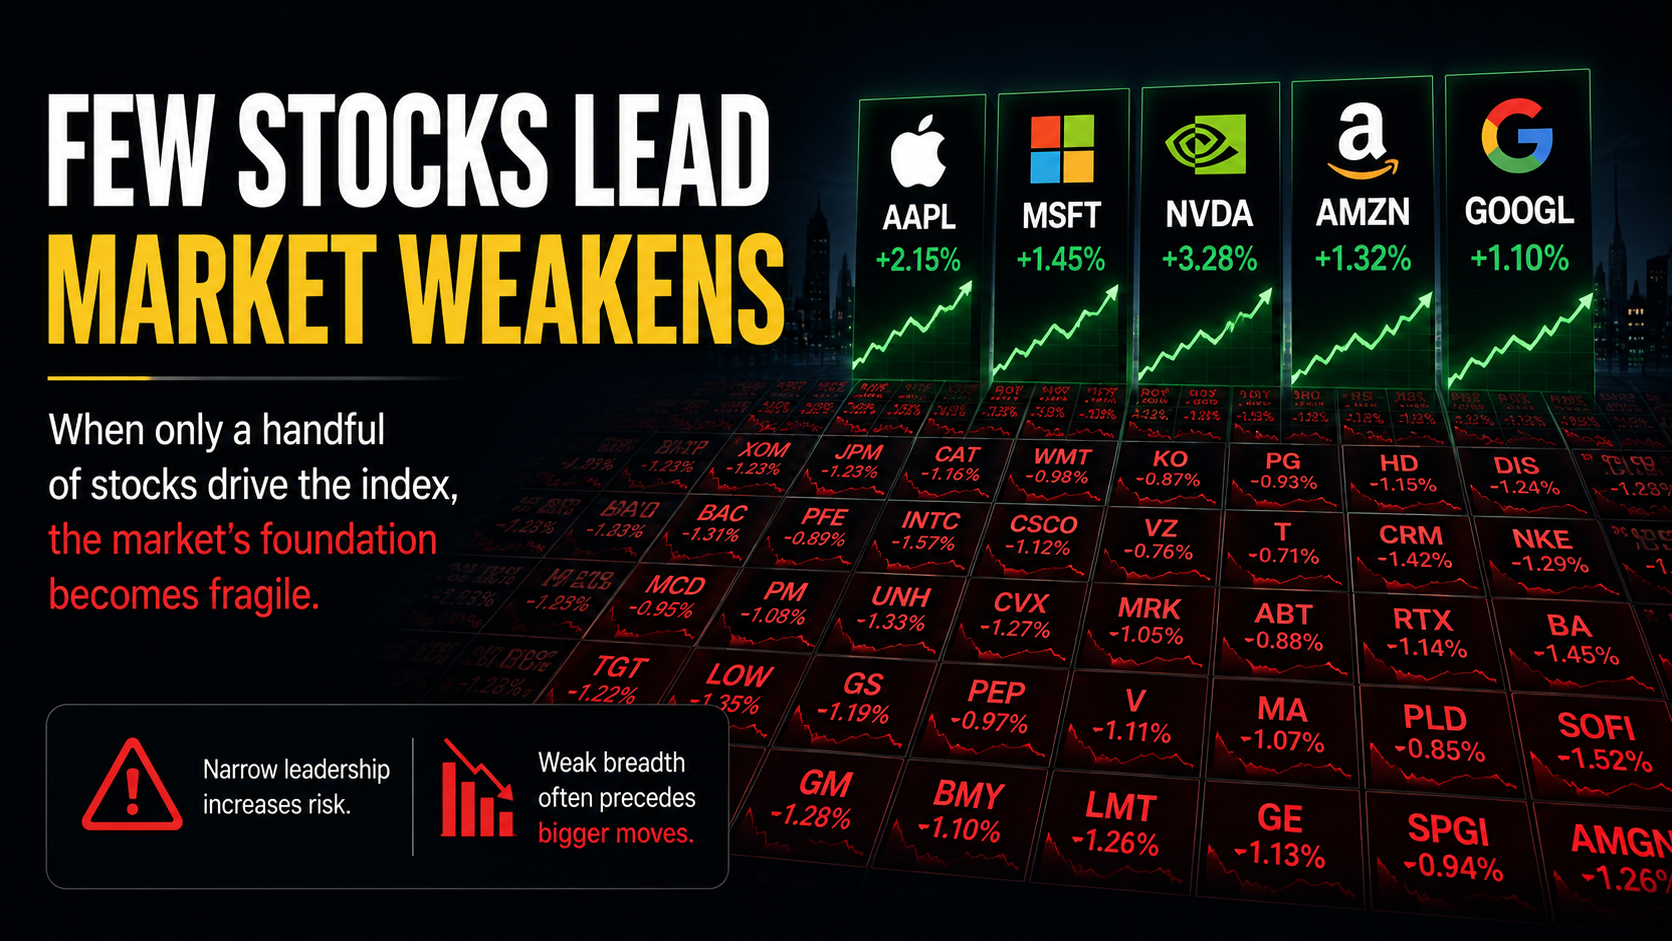
By contrast, when only a few mega-cap technology companies continue rising while most stocks struggle, the market experiences Breadth Contraction.
Although the index may continue advancing, its underlying foundation becomes narrower.
How Market Breadth Can Affect Different Asset Classes
| Asset | Broad Market Breadth | Weak Market Breadth |
| Stocks | More sectors participate in the rally, improving its durability | Gains become concentrated in fewer companies, increasing market fragility |
| Treasuries | Stronger risk appetite may reduce demand for safe-haven bonds | Investors often rotate toward Treasuries during periods of uncertainty |
| U.S. Dollar | Capital typically favors risk assets over cash | Safe-haven demand for the dollar can increase |
| Gold | Often sees reduced demand during broad risk-on environments | May benefit as investors seek defensive assets |
| Bitcoin | Can perform well when liquidity and risk appetite expand | Often experiences higher volatility during risk-off periods |
Key Takeaways for Investors
1. Don't Judge the Market by the Index Alone
Strong index performance doesn't necessarily mean the average stock is performing well.
Always look beneath the surface.
2. Watch for Divergences
If the S&P 500 reaches new highs while Market Breadth continues weakening, it may indicate that leadership is becoming increasingly concentrated.
That doesn't guarantee a market reversal, but it deserves attention.
3. Market Breadth Is a Risk Management Tool
Market Breadth is not designed to predict tomorrow's market direction.
Instead, it helps investors evaluate the quality and sustainability of a market trend.
Successful investing is often about managing risk rather than predicting every move.
What Smart Money Watches
Experienced investors rarely chase headlines.
Instead, they monitor where capital is actually flowing.
They ask questions such as
- Is money spreading across multiple sectors or flowing into only a few mega-cap stocks?
- Are small-cap and mid-cap stocks participating in the rally?
- Is market leadership becoming broader or narrower?
- Does my portfolio rely too heavily on a handful of stocks?
These questions provide valuable insight into the market's internal structure rather than its surface-level performance.
Ultimately, successful long-term investing is less about forecasting every market move and more about understanding the flow of capital.
Frequently Asked Questions
Does strong Market Breadth guarantee higher stock prices?
No.
Market Breadth measures market participation, not future price direction. It should be used alongside other technical, fundamental, and macroeconomic indicators.
Is the Advance-Decline Line the same as Market Breadth?
Not exactly.
The Advance-Decline Line is one of the most widely used indicators of Market Breadth, but investors also analyze moving-average participation, new highs versus new lows, and several other internal market indicators.
Why is the S&P 500 rising while many stocks are falling?
This usually happens when a relatively small number of large-cap companies account for most of the index's gains.
Because major indexes are market-cap weighted, strong performance from a handful of companies can outweigh weakness across hundreds of smaller stocks.
Final Thoughts
Market indexes tell us where the market is.
Market Breadth tells us how healthy the market is.
A rally supported by thousands of investors across many sectors is generally stronger than one carried by only a few dominant companies.
For long-term investors, understanding Market Breadth provides a deeper perspective on market trends, capital flows, and portfolio risk.
The most successful investors don't simply watch the index—they study the strength of the market beneath it.
This was MasterMind.
'[Global] Success Blueprints' 카테고리의 다른 글