Nasdaq Market Close August 31, 2026: Oil, Rising Yields, Top 5 Gainers & Losers and Where the Money Moved


U.S. stocks ended August 31, 2026 lower as renewed geopolitical tensions in the Middle East pushed oil prices higher and added another layer of inflation risk to an already rate-sensitive market.
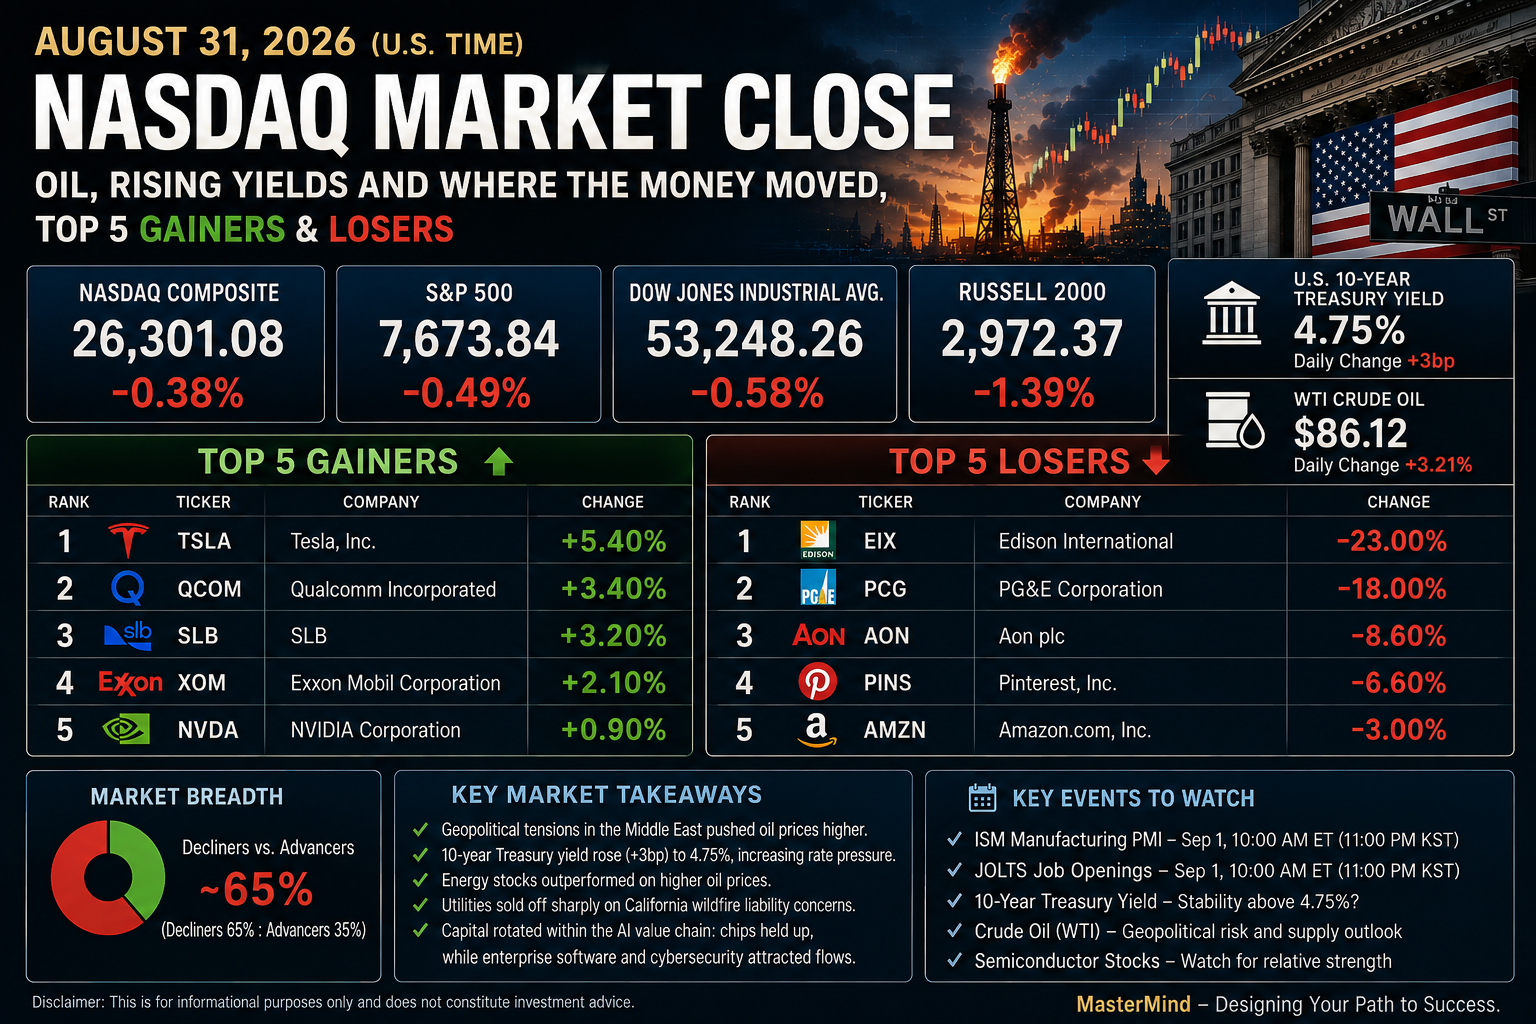
The Nasdaq Composite fell about 0.38% to 26,301.08, while the S&P 500 declined 0.49% and the Dow Jones Industrial Average lost 0.58%.
But the headline indexes only tell part of the story.
The more important question for investors is this
Where did the money actually move?
Despite weaker market breadth and rising Treasury yields, investors did not simply abandon risk assets. Energy stocks attracted clear buying interest as oil prices climbed, while select semiconductor names including Nvidia (NVDA) and Qualcomm (QCOM) held up surprisingly well.
At the same time, sharp selling in California utilities showed how quickly capital can leave companies facing company-specific regulatory and liability risks.
Bottom Line
Rising oil prices and a 10-year Treasury yield approaching 4.8% pressured the broader market, but capital rotated rather than simply exited: energy and select semiconductor stocks attracted buyers, while utilities exposed to California wildfire liability suffered severe selling pressure.
1. U.S. Stock Market Close
| Index | Close | Change |
| Nasdaq Composite | 26,301.08 | -0.38% |
| S&P 500 | 7,673.84 | -0.49% |
| Dow Jones Industrial Average | 53,248.26 | -0.58% |
The indexes themselves showed only a moderate pullback.
Underneath the surface, however, conditions were weaker.
On the Nasdaq, 3,088 stocks declined compared with just 1,610 advancing stocks, meaning decliners outnumbered advancers by roughly 1.9 to 1.
That distinction matters.
This wasn't simply a case of a handful of mega-cap technology companies dragging an otherwise healthy market lower. Risk appetite weakened across a much broader portion of the market.
Yet it wasn't indiscriminate selling either.
Energy emerged as the clearest area of strength, while several semiconductor stocks managed to advance despite an unfavorable combination of rising Treasury yields and a falling Nasdaq.
That gives us the first important clue about the day's capital flows
Broad market weakness → Energy strength → Selective semiconductor buying.
2. Why Did the Nasdaq Fall?
Two major forces drove the session.
Middle East Tensions Pushed Oil Higher
Renewed military tensions between the United States and Iran brought supply risks back into focus.
Oil prices responded quickly, with Brent crude moving above $90 per barrel.
For equity investors, the significance goes far beyond energy stocks.
The transmission mechanism looks something like this
Geopolitical escalation
↓
Oil supply concerns
↓
Higher energy prices
↓
Higher transportation and production costs
↓
Renewed inflation pressure
↓
More hawkish Federal Reserve expectations
↓
Higher Treasury yields
↓
Valuation pressure on growth stocks
This is why an oil shock can eventually become a Nasdaq problem.
Higher energy costs can spread through transportation, manufacturing, chemicals and consumer prices. If those pressures keep inflation elevated, the Federal Reserve has less room to ease monetary policy.
Rate-Hike Expectations Moved Higher
The oil move arrived at a time when investors were already digesting a more hawkish monetary-policy backdrop.
Market pricing for a 25-basis-point Fed rate increase in September moved to roughly 64%–66%.
That shift matters considerably more for technology stocks than the geopolitical headline alone.
The real concern for investors was not simply
“The conflict in the Middle East is getting worse.”
It was
“Could higher oil prices force the Fed to remain tighter for longer?”
That question moved directly into the Treasury market.
3. The 10-Year Treasury Yield
U.S. 10-Year Treasury Yield: intraday high of 4.764%
The 10-year yield moved closer to the psychologically important 4.8% level as investors repriced inflation and monetary-policy risks.
For growth investors, this is one of the most important numbers on the screen.
Why?
A stock represents the present value of the cash flows a company is expected to generate in the future.
When interest rates rise, the discount rate used to value those future earnings also increases.
The further those expected profits are in the future, the greater the valuation impact.
That makes high-growth technology, software and AI companies particularly sensitive to long-term Treasury yields.
But August 31 produced an important exception.
Even with the 10-year yield approaching 4.8%, several semiconductor stocks remained positive.
That suggests investors were not simply selling technology as a single trade.
They were becoming more selective.
4. Five Notable Gainers
These are not simply the five stocks with the largest percentage gains. They represent meaningful moves based on market relevance, sector implications and identifiable catalysts.
| Company | Business | Change | Key Driver |
| Tesla (TSLA) | EVs, autonomous driving, AI | +5.4% | Autonomous-driving expectations |
| Qualcomm (QCOM) | Semiconductors, edge AI | +3.4% | Relative semiconductor strength |
| SLB (SLB) | Oilfield services | +3.2% | Higher oil prices and Kelvion acquisition |
| Exxon Mobil (XOM) | Oil & gas | +2.1% | Brent crude above $90 |
| Nvidia (NVDA) | AI GPUs and data centers | +0.9% | AI semiconductor demand remained resilient |
Tesla (TSLA) +5.4%
Tesla stood out in a weak broader market.
While still best known as an electric-vehicle manufacturer, the company's valuation increasingly reflects expectations around autonomous driving, artificial intelligence and software.
Expectations surrounding new autonomous-driving capabilities helped drive the stock higher.
The more interesting signal was relative strength.
Tesla advanced despite a rising 10-year Treasury yield and broad weakness in growth stocks, demonstrating how a sufficiently strong company-specific catalyst can temporarily overpower macro pressure.
Qualcomm (QCOM) +3.4%
Qualcomm has expanded well beyond its traditional smartphone-chip business into automotive computing, PCs and on-device AI.
The stock gained 3.4% even as the Nasdaq declined.
That divergence matters.
If investors were abandoning semiconductors altogether because of higher rates, Qualcomm would be expected to participate in that weakness.
Instead, the stock showed relative strength.
The market appeared willing to retain exposure to semiconductor companies capable of converting AI and edge-computing demand into actual revenue opportunities.
SLB (SLB) +3.2%
SLB is one of the world's major oilfield-services companies.
The stock benefited from rising oil prices, but the session also included a company-specific catalyst: its approximately $4.1 billion acquisition of Kelvion.
This made SLB a particularly interesting example of the day's market structure.
It combined both forces supporting stocks on August 31
Sector-level energy momentum + company-specific catalyst.
Exxon Mobil (XOM) +2.1%
Exxon Mobil offered one of the clearest examples of the day's sector rotation.
With Brent crude above $90, investors moved toward large integrated energy companies positioned to benefit directly from higher commodity prices.
This wasn't an isolated Exxon move.
The strength extended across multiple energy names, making energy one of the clearest destinations for capital during the session.
Nvidia (NVDA) +0.9%
Nvidia's gain may look insignificant compared with Tesla or Qualcomm.
In context, however, it was important.
The Nasdaq declined.
Market breadth deteriorated.
Treasury yields increased.
Yet Nvidia still finished higher.
That suggests investors have not abandoned the AI infrastructure investment thesis.
Instead, they appear increasingly willing to distinguish between companies with visible AI demand and businesses whose valuations rely more heavily on distant growth expectations.
5. Five Notable Decliners
The downside of the market revealed an equally important pattern.
The most severe selling occurred not simply in rate-sensitive stocks, but in companies facing clear business, regulatory or liability catalysts.
| Company | Business | Change | Key Driver |
| Edison International (EIX) | Electric utility | about -23% | California wildfire liability concerns |
| PG&E (PCG) | Electric and gas utility | about -18% | Wildfire liability legislation |
| Aon (AON) | Insurance and risk consulting | about -8% to -9% | $17 billion USI acquisition |
| Pinterest (PINS) | Social media and digital advertising | -6.6% | CFO departure |
| Amazon (AMZN) | E-commerce, AWS, advertising | about -3% | FTC advertising-related regulatory risk |
Edison International (EIX) about -23%
Edison International suffered one of the session's most dramatic declines.
The company is the parent of Southern California Edison, making wildfire-related liabilities a major financial risk.
The selloff followed renewed concern over California legislation and the level of protection utilities could receive from wildfire-related insurance claims.
This was not a normal risk-off decline.
The market was reassessing the possibility of future cash outflows and financial liabilities.
PG&E (PCG) about -18%
PG&E fell for essentially the same structural reason.
Because both PG&E and Edison International experienced severe declines simultaneously, the move should not be viewed simply as two unrelated stock-specific events.
Investors were repricing California utility regulatory risk.
This distinction is important because sector-wide selling tied to a common catalyst can be much more informative than an isolated earnings miss.
Aon (AON) about -8% to -9%
Aon announced plans to acquire USI Insurance Services for approximately $17 billion.
While the deal could expand Aon's long-term position in the insurance brokerage and risk-management market, investors focused on the near-term price of that expansion.
The market's concern centered on the acquisition price and additional debt burden.
The lesson is straightforward
Growth isn't automatically rewarded.
The market also asks how much a company must pay to obtain that growth.
Pinterest (PINS) -6.6%
Pinterest fell 6.6% following news of its CFO's departure.
Management changes can create uncertainty even when a company's underlying business has not immediately deteriorated.
In an already weak market, that additional uncertainty was enough to intensify selling pressure.
Amazon (AMZN) about -3%
Amazon declined roughly 3%, making it an important contributor to broader technology weakness.
The move was not purely about Treasury yields.
The company also faced regulatory concerns connected with an FTC advertising case.
Amazon therefore faced two pressures simultaneously
Higher-rate valuation pressure + company-specific regulatory risk.
That makes the decline more meaningful than simply categorizing it as another weak mega-cap technology stock.
6. Where Did the Money Actually Go?
This is the most important part of the August 31 session.
Stocks fell broadly, but capital did not simply disappear.
It rotated.
Energy Was the Clearest Winner
The chain was straightforward
Brent crude above $90
↓
Exxon Mobil and Chevron higher
↓
SLB, Halliburton and Valero also stronger
This was not merely a defensive-stock trade.
Investors were buying companies capable of directly benefiting from higher oil prices and concerns about global energy supply.
The more accurate description is
Capital rotated toward the energy value chain most directly exposed to higher commodity prices.
Semiconductors Saw Selective Buying, Not Broad Selling
This was arguably the most interesting development of the session.
Despite a lower Nasdaq and higher Treasury yields
Qualcomm +3.4%
SanDisk +1.2%
Nvidia +0.9%
The conclusion is important.
This was not evidence that investors were abandoning AI semiconductors.
Instead, the market appeared to be saying
Higher rates reduce appetite for technology broadly, but companies with visible demand and earnings exposure can still attract capital.
The AI trade is becoming more selective.
Utilities Saw Real Capital Flight
The opposite happened in California utilities.
PG&E → Edison International
Both experienced severe selling tied to the same underlying issue: wildfire liability and regulatory uncertainty.
This wasn't simply the usual pressure utilities experience when bond yields rise.
It was
Policy risk → Potential liabilities → Expected cash-flow impact → Valuation reset
That is a much more powerful reason for capital to leave a sector.
7. MasterMind's Insight
First: The Most Important Number Wasn't the Nasdaq's Decline
The Nasdaq fell less than half a percent.
The more important number was the 10-year Treasury yield reaching 4.764% intraday.
If the yield moves decisively above 4.8% and remains there, valuation pressure on high-P/E growth stocks could intensify.
For investors, the bond market may therefore provide a more important short-term signal than the Nasdaq itself.
Second: Semiconductor Relative Strength Matters
Consider the environment
Nasdaq lower
10-year yield higher
Market breadth weaker
Normally, that is an unfavorable combination for growth stocks and semiconductors.
Yet Nvidia, Qualcomm and SanDisk advanced.
That suggests investors have not rejected the AI investment cycle.
Instead, capital appears to be moving toward businesses where AI demand can be connected to actual revenue, infrastructure spending and earnings.
Third: The Market Was Weaker Than the Index Suggested
There were 3,088 declining Nasdaq stocks compared with 1,610 advancing stocks.
That's a much weaker internal market than a roughly 0.4% index decline might suggest.
Investors therefore shouldn't assume that a relatively small index loss means market conditions remain uniformly healthy.
The internal structure looked more like
Broad risk reduction → Policy-sensitive stocks hit hardest → Energy and select semiconductors attract capital.
Recent Five-Day Capital Flow
Looking beyond a single session reveals another important pattern.
Money does not appear to be leaving the AI theme altogether.
Instead, it has been moving inside the AI value chain.
Around Nvidia's earnings, semiconductor and AI hardware stocks experienced profit-taking. Capital then broadened toward enterprise software and cybersecurity companies with stronger earnings visibility.
On August 31, however, selected semiconductor names again outperformed despite higher Treasury yields.
The recent pattern therefore looks less like
Capital exiting AI
and more like
Semiconductors and hardware → Enterprise software and security → Back toward selected semiconductor names with visible demand
This is an increasingly selective AI market.
The major risk to that rotation remains Treasury yields. If the 10-year yield continues rising, valuation pressure could eventually spread across the entire AI ecosystem.
8. What to Watch Next
The next U.S. trading session is Tuesday, September 1, 2026.
Several variables deserve particular attention.
ISM Manufacturing
10:00 a.m. ET
11:00 p.m. KST
The headline manufacturing number matters, but investors should pay particular attention to the Prices Paid component.
With oil already rising, another acceleration in manufacturing input costs could reinforce inflation concerns and strengthen expectations for tighter Fed policy.
JOLTS Job Openings
10:00 a.m. ET
11:00 p.m. KST
A stronger-than-expected labor market could give the Federal Reserve more room to remain restrictive.
A significant deterioration in labor demand, however, could push back against the recent increase in rate-hike expectations.
The 10-Year Treasury at 4.8%
With the 10-year yield reaching 4.764% intraday, 4.8% becomes the next key level to watch.
If economic data pushes yields decisively above that threshold, high-valuation technology stocks could face another round of pressure.
If yields retreat toward the low-to-mid 4.7% range, growth stocks could regain some breathing room.
Energy and Semiconductor Relative Strength
Watch whether the buying in energy continues.
At the same time, Nvidia, Qualcomm and other semiconductor stocks could provide an important risk signal.
If they remain strong even with elevated yields, the AI infrastructure trade remains intact.
If semiconductors begin falling alongside higher yields, it would indicate that risk reduction is spreading into one of the market's strongest remaining growth themes.
Final Takeaway
Middle East tensions pushed oil higher and helped drive the 10-year Treasury yield to 4.764%, pressuring the Nasdaq, but the real story was rotation: capital moved toward energy and selected semiconductor companies with visible demand, while utilities facing regulatory and wildfire-liability risks experienced severe capital outflows.
Closing Thoughts
August 31 looked like an ordinary down day if you only watched the major indexes.
Underneath the surface, it was much more revealing.
Geopolitical risk pushed oil higher. Higher oil prices increased inflation concerns. Those concerns strengthened expectations for tighter Federal Reserve policy and pushed long-term Treasury yields toward 4.8%.
Yet investors did not sell everything.
Energy attracted clear buying interest, while Nvidia, Qualcomm and other select semiconductor names showed that investors were still willing to pay for visible AI demand.
At the same time, PG&E and Edison International demonstrated what happens when a specific regulatory risk threatens future cash flows: capital can exit quickly and aggressively.
That is why our daily framework remains
Indexes → Interest Rates → Volume → Sectors → Individual Stocks
The goal isn't simply to know whether the Nasdaq rose or fell.
The goal is to understand
Why did it move? → Where did trading concentrate? → Where did the money actually go?
This was MasterMind, designing the path to success.
Disclaimer: This article is for market information and educational purposes only and does not constitute a recommendation to buy or sell any security.
'[Global] Success Blueprints' 카테고리의 다른 글