What Is a Stock Gap? How Gap Ups, Gap Downs, and Gap Fills Work


Hello, this is MasterMind.
If you spend enough time looking at U.S. stock charts, you will eventually notice something unusual: a stock closes at one price, then opens the next trading session significantly higher or lower, leaving an empty space on the chart.
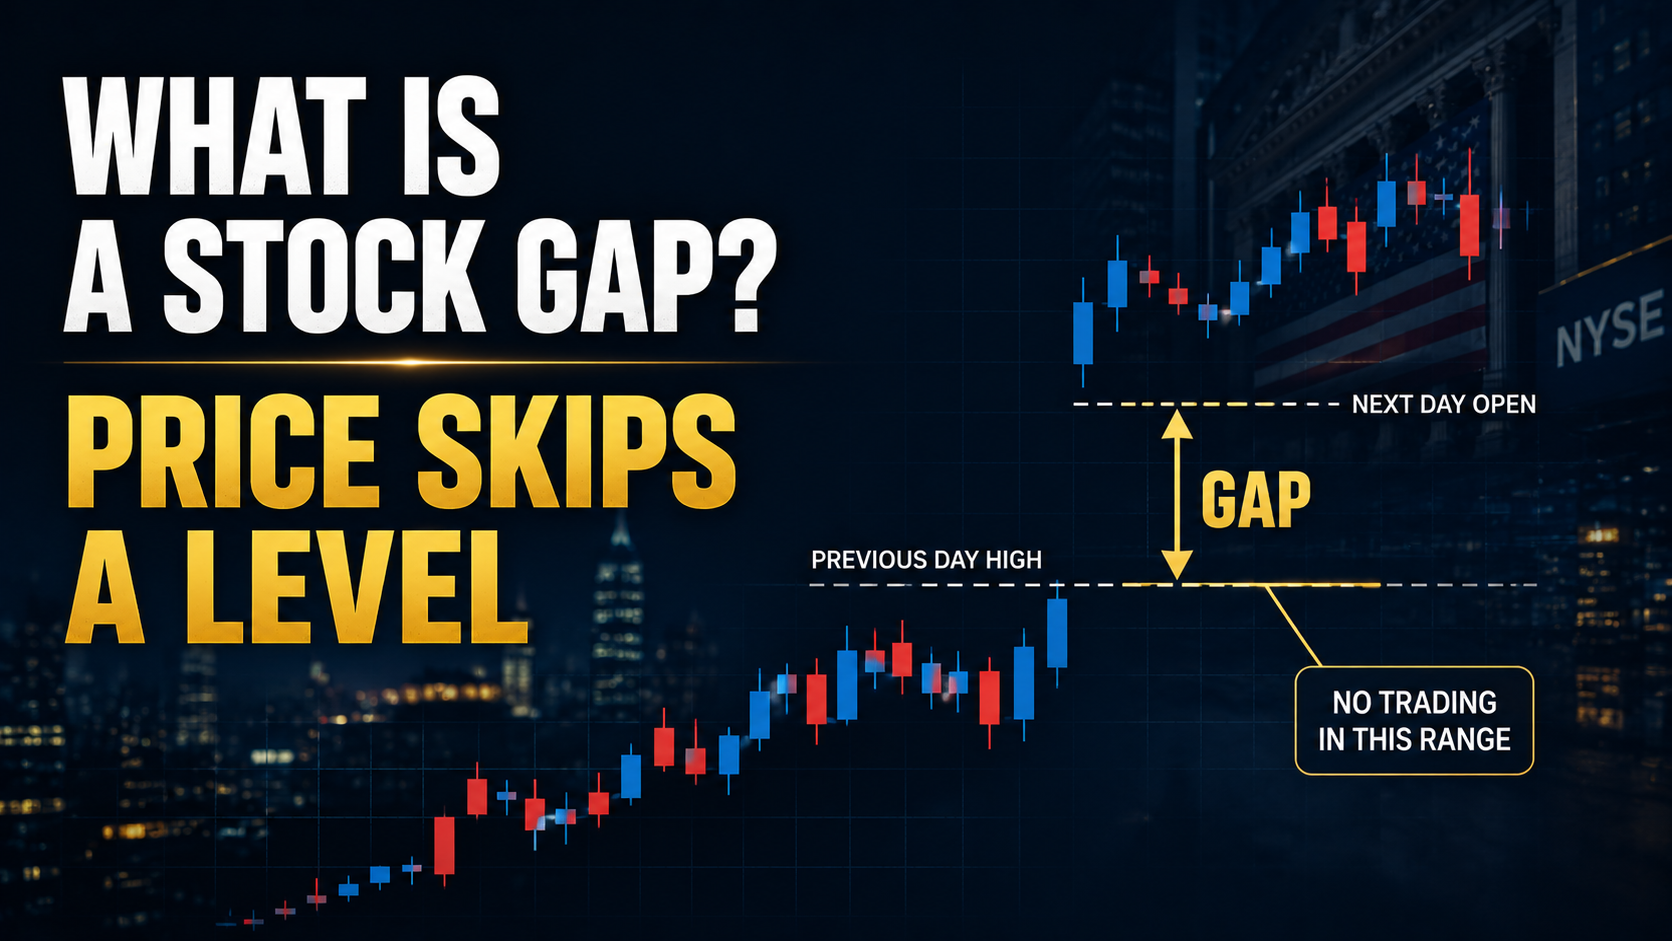
A stock might close at $100 and open the next morning at $107 without ever trading at $101, $102, or $103 during the regular session.
That empty area is called a stock gap.
But why do stock gaps happen? Does a gap up signal further gains? Does a gap down mean more losses are coming? And what about the popular Wall Street saying that "gaps always get filled"?
To understand gaps properly, investors need to look beyond technical chart patterns.
A gap is ultimately a visible record of something deeper: the market rapidly changing its expectations and repricing an asset before normal trading can catch up.
Key Takeaway
A stock gap occurs when a stock begins trading significantly above or below its previous trading range, usually because new information changes investor expectations and creates a sudden imbalance between buyers and sellers.
1. What Is a Stock Gap?
A stock gap is an area on a price chart where little or no trading occurred between two price ranges.
Suppose a stock closes near $100.
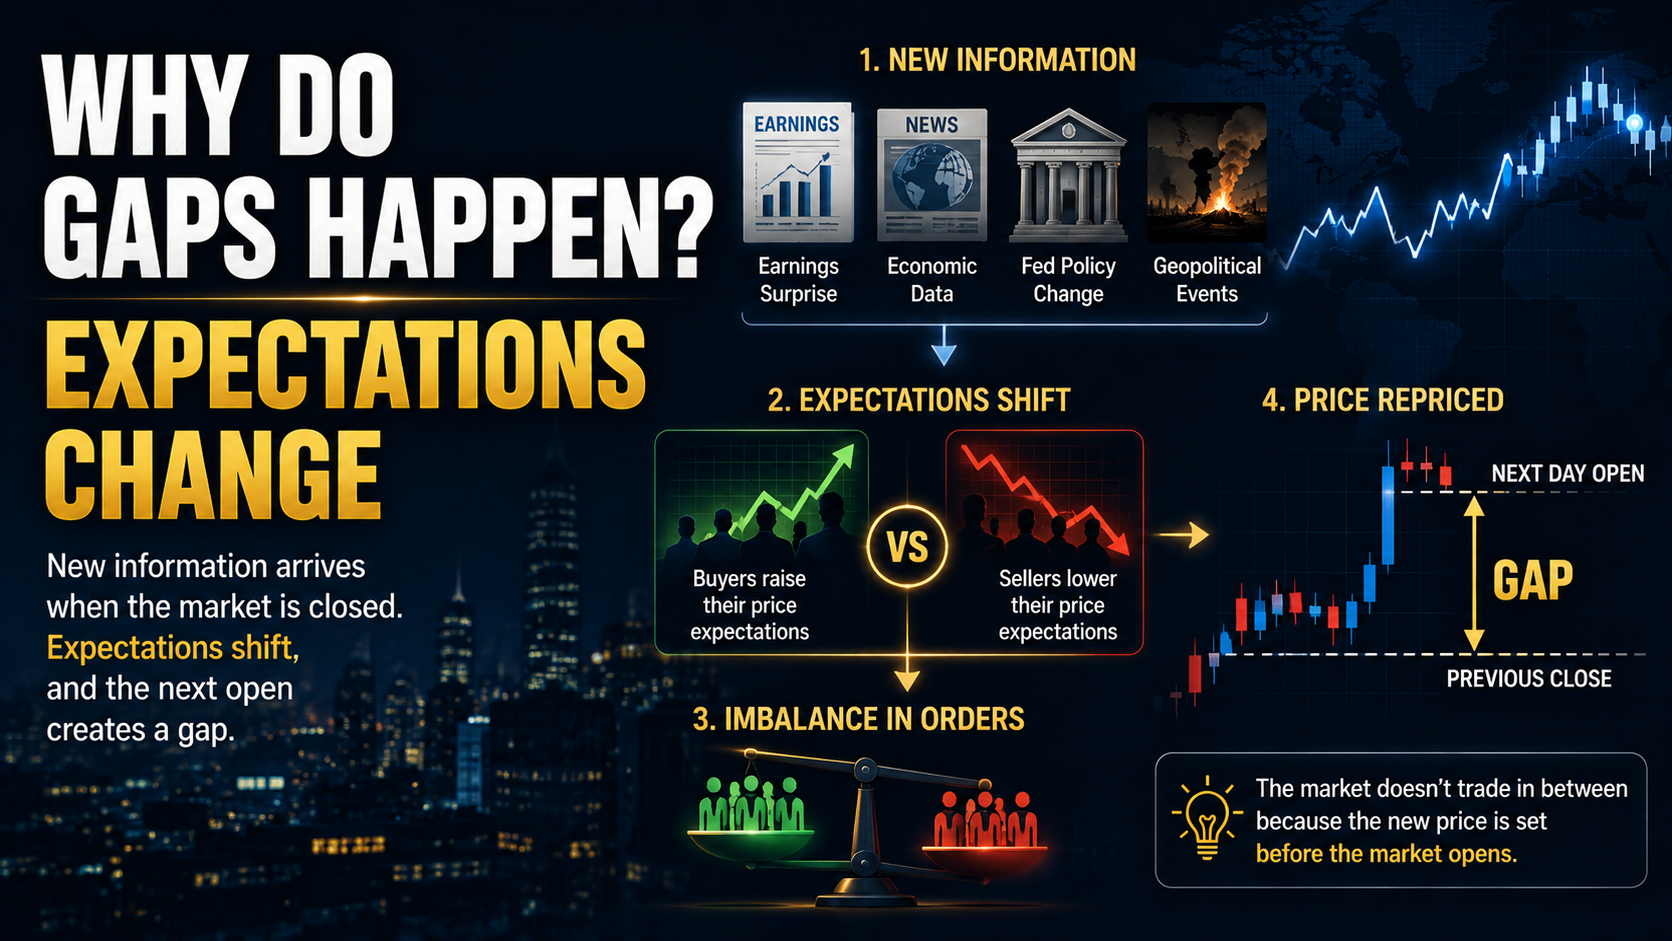
After the market closes, the company reports earnings that are far better than Wall Street expected. Investors immediately reassess the company's future earnings potential.
By the next morning, buyers may be willing to pay $106 or $107.
If the new session begins above the previous day's trading range, a visible gap appears on the chart.
There are two basic directions.
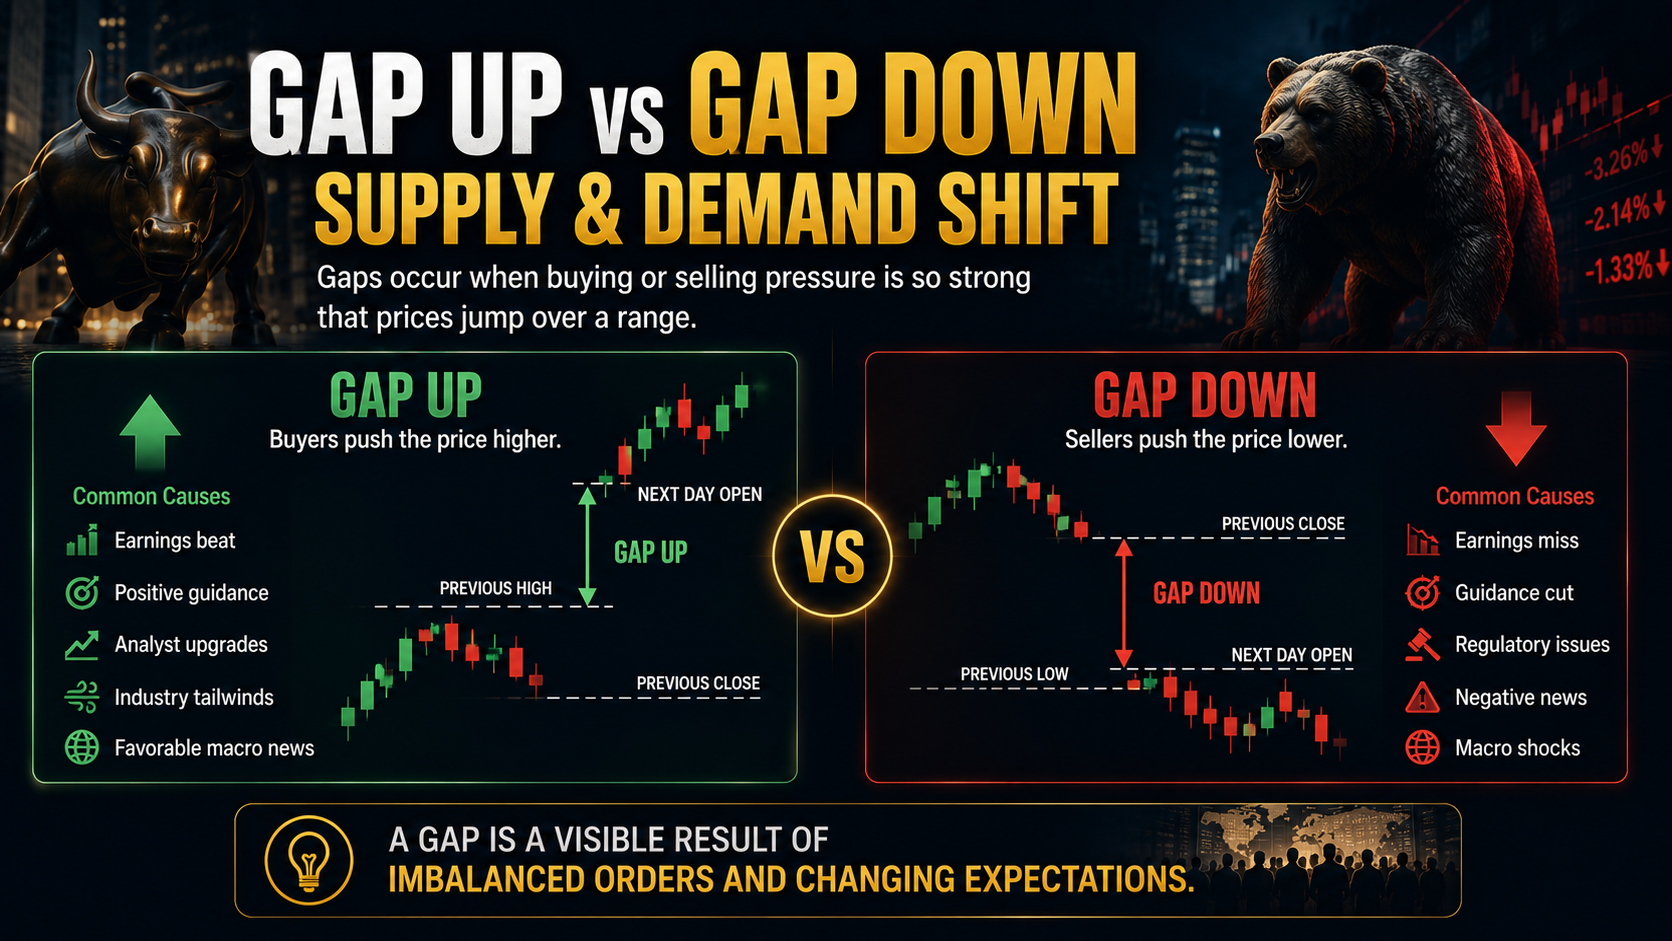
What Is a Gap Up?
A gap up occurs when a stock begins trading above its previous price range.
A particularly clear gap appears when the new session's low remains above the previous session's high.
Gap ups can occur after events such as
- Earnings beats
- Strong forward guidance
- Analyst upgrades
- Merger or acquisition announcements
- Regulatory approvals
- Favorable industry developments
- Unexpected improvements in the macroeconomic environment
What Is a Gap Down?
A gap down occurs when a stock begins trading below its previous price range.
A clear downside gap exists when the new session's high remains below the previous session's low.
Potential catalysts include
- Earnings misses
- Guidance cuts
- Regulatory problems
- Failed clinical trials
- Unexpected management changes
- Industry disruptions
- Macroeconomic shocks
The direction of the gap tells us what happened to price.
It does not, by itself, tell us what happens next.
| Gap Type | Basic Meaning | Common Catalyst |
| Gap Up | Price moves above the previous range | Earnings beat, guidance raise, positive catalyst |
| Gap Down | Price moves below the previous range | Earnings miss, guidance cut, negative catalyst |
| Gap Fill | Price later returns into the gap area | Profit-taking, changing expectations, shifting supply and demand |
That distinction is essential because a gap up does not guarantee another rally, and a gap down does not automatically mean the company's long-term value has collapsed.
2. Why Do Stock Gaps Happen?
The U.S. stock market has defined regular trading hours, but information never stops flowing.
Companies frequently report earnings after the closing bell or before the next session opens.
Economic data can arrive before the market opens.
Federal Reserve officials can change interest-rate expectations.
Foreign markets continue trading while U.S. exchanges are closed.
Geopolitical events can happen overnight.
Investors therefore continue reassessing what stocks should be worth even when regular trading is unavailable.
The basic process looks like this
New information → Expectations change → Orders become imbalanced → Price adjusts → Gap appears
Imagine a company closes at $100 and then announces earnings significantly above Wall Street's consensus estimate.
Before the announcement, sellers may have been comfortable selling near $100.
After the announcement, they may no longer be willing to sell at that price.
Buyers must offer increasingly higher prices until they find enough sellers.
The next meaningful equilibrium might be $107 rather than $100.
The market has effectively skipped the prices in between.
That is the economic logic behind a gap.
3. The Mechanics Behind a Gap: Supply and Demand Reprice the Stock
A stock gap is often described as a technical pattern, but the underlying mechanism is fundamentally about supply, demand, and expectations.
Step 1: New Information Arrives
Something changes the market's assumptions.
It might be an earnings report, inflation data, employment numbers, a Federal Reserve decision, or a company-specific development.
Step 2: Investors Recalculate Value
Investors update their expectations for future earnings, cash flow, growth, risk, or valuation multiples.
If the new information is significant enough, yesterday's price may suddenly look outdated.
Step 3: Buy and Sell Orders Become Imbalanced
Suppose buyers want shares at $100 but almost nobody wants to sell there anymore.
Buyers must raise their bids.
The opposite happens during a negative shock: sellers may accept substantially lower prices because buyers disappear from the previous range.
Step 4: A New Market Price Is Established
Trading eventually begins where enough buyers and sellers are willing to transact.
If that equilibrium is far from the previous range, a gap appears.
This is why a gap is more than a chart pattern.
It is evidence that the market's previous equilibrium price has temporarily—or sometimes permanently—broken down.
4. Stock Gaps Are Really About Expectations
One of the most important lessons for U.S. equity investors is that markets do not simply react to whether news is "good" or "bad."
Markets react to how reality compares with expectations already embedded in the price.
Consider a company that reports 20% earnings growth.
That sounds positive.
But what if Wall Street expected 30%?
The stock could gap down despite reporting strong growth.
Now consider a company whose earnings fall 10%.
That sounds negative.
But if analysts expected a 25% decline, investors may interpret the result as much better than feared.
The stock could gap higher.
This reveals one of the most important principles of financial markets
Markets often respond less to good versus bad news than to the difference between expectations and reality.
That is why investors analyzing an earnings gap should look beyond the headline EPS number.
Consensus estimates, forward guidance, margins, revenue growth, free cash flow, and management commentary may matter far more.
5. Why Are Stock Gaps Important?
Gaps matter because they can reveal how aggressively the market is reassessing an asset.
Three factors are particularly useful.
The Size of the Repricing
A large gap suggests that investors may have significantly changed their assumptions.
But the size alone does not tell investors whether that repricing will last.
Trading Volume
Volume can provide additional context.
A major gap accompanied by unusually high volume may indicate broad participation in the repricing.
A gap occurring on thin volume may deserve more caution.
What Happens After the Gap
This is often more informative than the opening move itself.
Suppose a stock gaps 10% higher after earnings and then remains near those levels throughout the session and subsequent days.
The market may be accepting the new valuation range.
If the stock gaps 10% higher and immediately sells off back toward the previous close, investors may be rejecting at least part of the initial repricing.
The gap gets attention. The behavior after the gap provides context.
6. The Four Main Types of Stock Gaps
Technical analysis commonly divides gaps into four broad categories.
These categories should not be treated as predictive laws. They are better understood as frameworks for interpreting where a gap occurs within a larger market trend.
1. Common Gap
A common gap usually appears within a relatively quiet or sideways market.
It may occur without a major fundamental catalyst and can be particularly common in less liquid securities.
Because it does not necessarily represent a major change in investor expectations, the gap may eventually disappear as normal trading resumes.
2. Breakaway Gap
A breakaway gap occurs when price escapes from an established trading range or important technical area.
Imagine a stock trading between $90 and $100 for several months.
The company then reports a major improvement in profitability and opens at $108 on extremely heavy volume.
The market may be moving from one valuation regime to another.
This is why breakaway gaps receive considerable attention.
The key question is not merely whether resistance was broken.
It is whether something fundamental has changed enough to justify the new price regime.
3. Runaway or Continuation Gap
A runaway gap, also called a continuation gap, occurs during an existing trend.
During a strong bull move, another positive catalyst may accelerate buying.
During a strong decline, another negative development may accelerate selling.
Such gaps can indicate momentum, but they also require context.
The further a trend has already traveled, the more investors should consider whether momentum is becoming crowded.
4. Exhaustion Gap
An exhaustion gap can appear near the later stages of a powerful trend.
After an extended rally, investors who fear missing out may rush into the stock simultaneously.
During a prolonged decline, capitulation selling may create the opposite effect.
The difficulty is that continuation gaps and exhaustion gaps can look remarkably similar when they first appear.
Only subsequent price behavior, volume, and fundamental developments reveal which interpretation was more appropriate.
| Gap Type | Typical Location | Possible Interpretation |
| Common Gap | Sideways market | Temporary price discontinuity |
| Breakaway Gap | Range breakout | Potential new trend or valuation regime |
| Continuation Gap | Middle of a trend | Existing trend may be accelerating |
| Exhaustion Gap | Late in a strong trend | Momentum may be approaching exhaustion |
This is why investors should be cautious about labeling a gap immediately.
The classification often becomes clearer only afterward.
7. Can a Stock Gap Become Support or Resistance?
Gap areas can become psychologically important price zones.
Suppose a stock gaps higher after earnings and continues rallying.
If the stock later declines toward the original gap area, some investors may view that zone as a potential support level.
The reverse can happen after a gap down.
If a stock later rallies back toward the gap, investors who were trapped at higher prices may sell, potentially creating resistance.
But gaps are not magical support and resistance levels.
Their importance comes from the behavior of market participants.
Lines on a chart do not move markets. Investors remembering, defending, buying, and selling around those prices do.
Support and resistance are therefore better viewed as areas where investor positioning and psychology may become concentrated rather than guaranteed turning points.
8. What Is a Gap Fill?
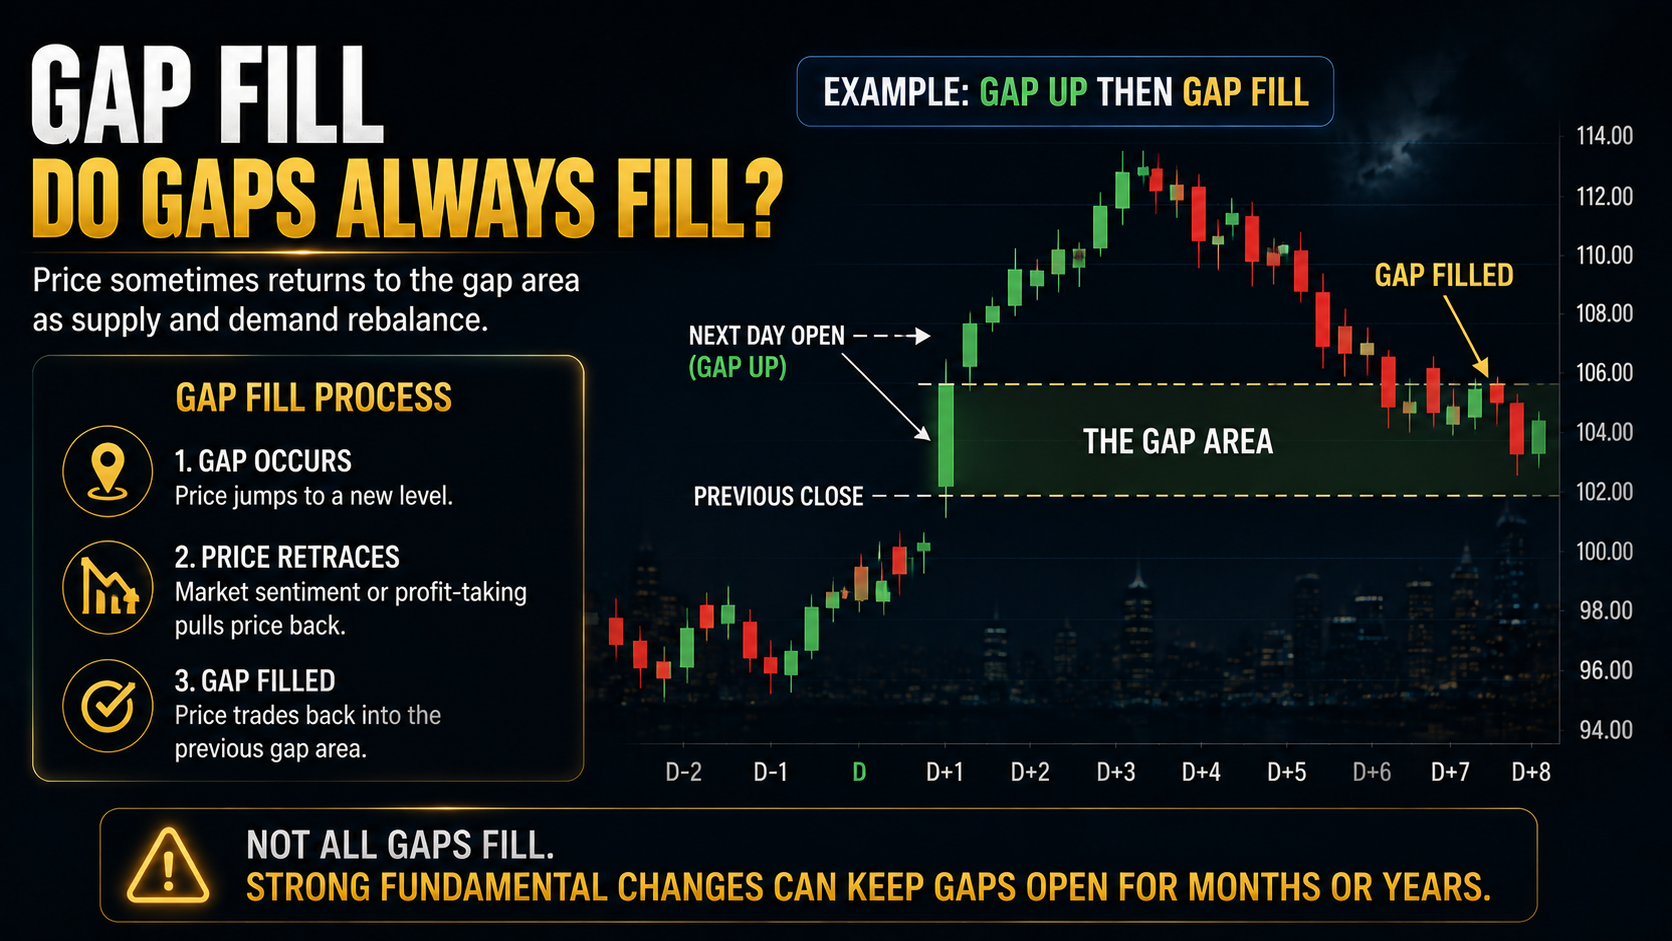
A gap fill occurs when price eventually returns to the area that was skipped during the original gap.
For example, suppose a stock closes at $100 and opens the following session at $105.
The $100-to-$105 region becomes the gap area.
If the stock later declines through that region, traders may describe the gap as being partially or completely filled.
Do All Stock Gaps Eventually Get Filled?
No.
One of the most persistent market sayings is that "all gaps eventually get filled."
Investors should not treat this as a market law.
Some gaps are filled quickly.
Others remain open for months or years.
Some may never be revisited within a practical investment horizon.
Why?
Because the information responsible for the gap may permanently alter the market's assessment of the company.
If a business suddenly demonstrates substantially higher long-term earnings power, the old valuation may no longer be relevant.
The better question is therefore not
"Will this gap fill?"
It is
"Was the change that created this gap temporary, or did it permanently change the company's future cash-flow expectations?"
That question connects technical price action with fundamental analysis.
9. Stock Gaps Across U.S. Financial Markets
Although gaps are most familiar on individual stock charts, similar repricing can occur across many financial markets.
| Asset | Typical Catalyst | What Investors May Watch |
| U.S. Stocks | Earnings, guidance, M&A, regulation | Earnings expectations, volume |
| S&P 500 / Nasdaq | Macro data, Fed expectations, geopolitical shocks | Rates, risk appetite, breadth |
| Treasuries | Inflation, employment, Fed policy | Yield expectations |
| U.S. Dollar | Relative monetary policy, risk sentiment | Rate differentials, capital flows |
| Gold | Real yields, dollar, risk aversion | Real interest rates, liquidity |
| Bitcoin | Liquidity, leverage, risk appetite | Global liquidity, positioning |
Bitcoin deserves a special distinction.
Spot cryptocurrency markets operate continuously, so traditional overnight gaps work differently from stocks.
However, CME Bitcoin futures operate according to exchange trading schedules. If Bitcoin moves substantially while CME futures are closed, a visible CME futures gap can appear when trading resumes.
As with stock gaps, however, the existence of a CME gap does not guarantee that Bitcoin must later return to that price.
10. What Investors Should Check After a Stock Gaps
Instead of treating every gap as a buy or sell signal, investors can use a simple framework.
Identify the Catalyst
Why did the gap occur?
Was it caused by earnings, guidance, interest rates, regulation, an industry development, or broad market risk?
Understanding the catalyst comes before interpreting the chart.
Compare Reality With Expectations
An earnings beat means little without knowing what investors had already priced in.
Look at consensus expectations and, more importantly, changes to the forward outlook.
Examine Volume
Was the repricing accompanied by unusually heavy trading?
Volume does not guarantee continuation, but it can provide information about the intensity of participation.
Look at the Existing Trend
A gap after months of consolidation may mean something different from a gap after a stock has already doubled.
Context matters.
Watch Whether the New Price Holds
A gap that survives subsequent selling pressure can carry a different message from one that immediately reverses.
Return to Fundamentals
Ultimately, investors should ask whether the event changed
- Revenue expectations
- Operating margins
- Earnings
- Free cash flow
- Balance-sheet strength
- Competitive positioning
- Long-term growth prospects
The chart tells you that the market changed its mind.
Fundamental analysis helps explain whether it had a good reason to do so.
11. Why Chasing a Gap Up Can Be Dangerous
Large gap ups naturally attract attention.
A stock opening 15% higher after earnings can create a powerful fear of missing out.
But two very different situations can produce a similar chart.
In the first case, the company may have revealed a structural improvement in its business. Earnings expectations rise for several years, margins improve, and analysts significantly increase their estimates.
A higher valuation may therefore be justified.
In the second case, investors may simply be reacting emotionally to a widely anticipated catalyst.
Early buyers take profits, momentum traders exit, and the stock quickly gives back much of its opening gain.
The important question is therefore not how large the gap is.
It is
Did future cash-flow expectations change enough to justify the new valuation?
Price can change dramatically overnight.
Intrinsic business value usually requires more analysis.
12. Why a Gap Down Is Not Automatically a Buying Opportunity
The opposite mistake happens during sharp gap downs.
Investors see a stock fall 20% overnight and immediately conclude that it has become cheap.
But a lower price and better value are not the same thing.
If the company permanently loses customers, margins deteriorate, debt becomes difficult to service, or its competitive advantage disappears, the decline may reflect a genuine reduction in long-term value.
On the other hand, broad market stress can occasionally cause financially strong companies to decline alongside weaker businesses.
The investor's job is to separate
company-specific deterioration, industry-wide change, and market-wide liquidity pressure.
That distinction matters far more than the size of the red candle.
13. What Do Wealthy and Institutional Investors Look for?
Experienced investors tend to view gaps differently from traders focused primarily on the next price move.
The central question becomes
What kind of capital movement created the gap?
Follow the Money
If one company gaps higher, the catalyst may be company-specific.
If semiconductor companies, software stocks, and other growth assets gap lower simultaneously, the underlying driver could instead be rising Treasury yields or changing expectations for Federal Reserve policy.
Looking across assets helps investors distinguish a company event from a broader capital rotation.
Focus on Cash Flow
Long-term capital ultimately depends on cash generation.
A gap becomes more meaningful when the catalyst materially changes future revenue, margins, earnings, or free cash flow.
Market sentiment can reverse quickly.
Sustainable cash flow is harder to fake.
Evaluate Asset Survivability
A dramatic gap down raises another important question
Can the company survive if conditions remain difficult?
Balance-sheet strength, debt maturities, interest expense, liquidity, and competitive position become crucial.
A stock becoming cheaper does not automatically make the underlying business safer.
Think in Years, Not Opening Prints
Long-term investors ultimately care less about where a stock opens tomorrow than about the cash flows the business can produce over the next several years.
Useful questions include
- What information actually caused this gap?
- What did Wall Street expect before the announcement?
- Did long-term cash-flow expectations change?
- Is money moving into one stock or an entire sector?
- Is trading volume confirming broad participation?
- Is the market accepting the new price range?
- Can the company survive a prolonged downturn?
- If my interpretation is wrong, can my portfolio survive the mistake?
That last question is particularly important.
Investing is not about correctly predicting every gap. It is about building a portfolio capable of surviving when the market does something you did not predict.

14. The Most Important Lesson About Stock Gaps
A stock gap is not merely empty space on a chart.
It contains information about expectations, liquidity, positioning, and capital flows.
A gap up does not guarantee higher prices.
A gap down does not guarantee further losses.
And the belief that every gap must eventually be filled should not be treated as a universal trading rule.
Instead, investors should ask five questions
Why did the gap occur?
What was the market expecting beforehand?
Was significant volume involved?
Did the new price range hold?
Did the company's long-term cash-flow outlook actually change?
These questions transform gap analysis from a simple chart-reading exercise into a framework for understanding how markets process new information.
Final Thoughts
Stock gaps occur when investors rapidly reassess what an asset should be worth and the new equilibrium price forms outside the previous trading range.
Earnings reports, economic data, interest rates, Federal Reserve policy, industry developments, and unexpected events can all trigger that repricing.
The important lesson is not to assume that a gap up means "buy," a gap down means "sell," or an unfilled gap must eventually disappear.
Instead, examine the catalyst, expectations, volume, subsequent price behavior, and—most importantly—the company's long-term ability to generate cash.
If there is one idea to remember, it is this
A gap is not a prediction of where a stock will go next. It is evidence of how quickly market expectations and capital have moved.
Understanding why that movement occurred can turn a seemingly simple chart pattern into a useful window into market psychology, liquidity, and valuation.
And in long-term investing, accurately predicting every market move matters less than having the discipline and financial resilience to survive the moves you never saw coming.
This was MasterMind.
'[Global] Success Blueprints' 카테고리의 다른 글