What Is a Moving Average in Stocks? 20-Day, 50-Day & 200-Day Moving Averages Explained


Hello, this is MasterMind.
Open almost any stock chart on an American brokerage platform and you will see lines moving alongside the price.
The 20-day, 50-day, and 200-day moving averages are among the most widely followed. Financial media frequently mention the S&P 500 crossing its 200-day moving average, a technology stock losing its 50-day line, or a major index forming a Golden Cross.
But why should investors care about a line calculated entirely from past prices?
A moving average cannot predict where a stock will trade tomorrow. Its real value is different: it helps investors filter out short-term market noise and understand trend direction, price momentum, investor psychology, and changes in the flow of capital.
Key Takeaway
A moving average is a technical indicator that smooths past price data to show the underlying trend of a stock, index, bond, commodity, currency, or cryptocurrency.
For long-term investors, its greatest value is not telling them exactly when to buy or sell. It is providing context about whether the market's underlying price trend is strengthening, weakening, or changing.
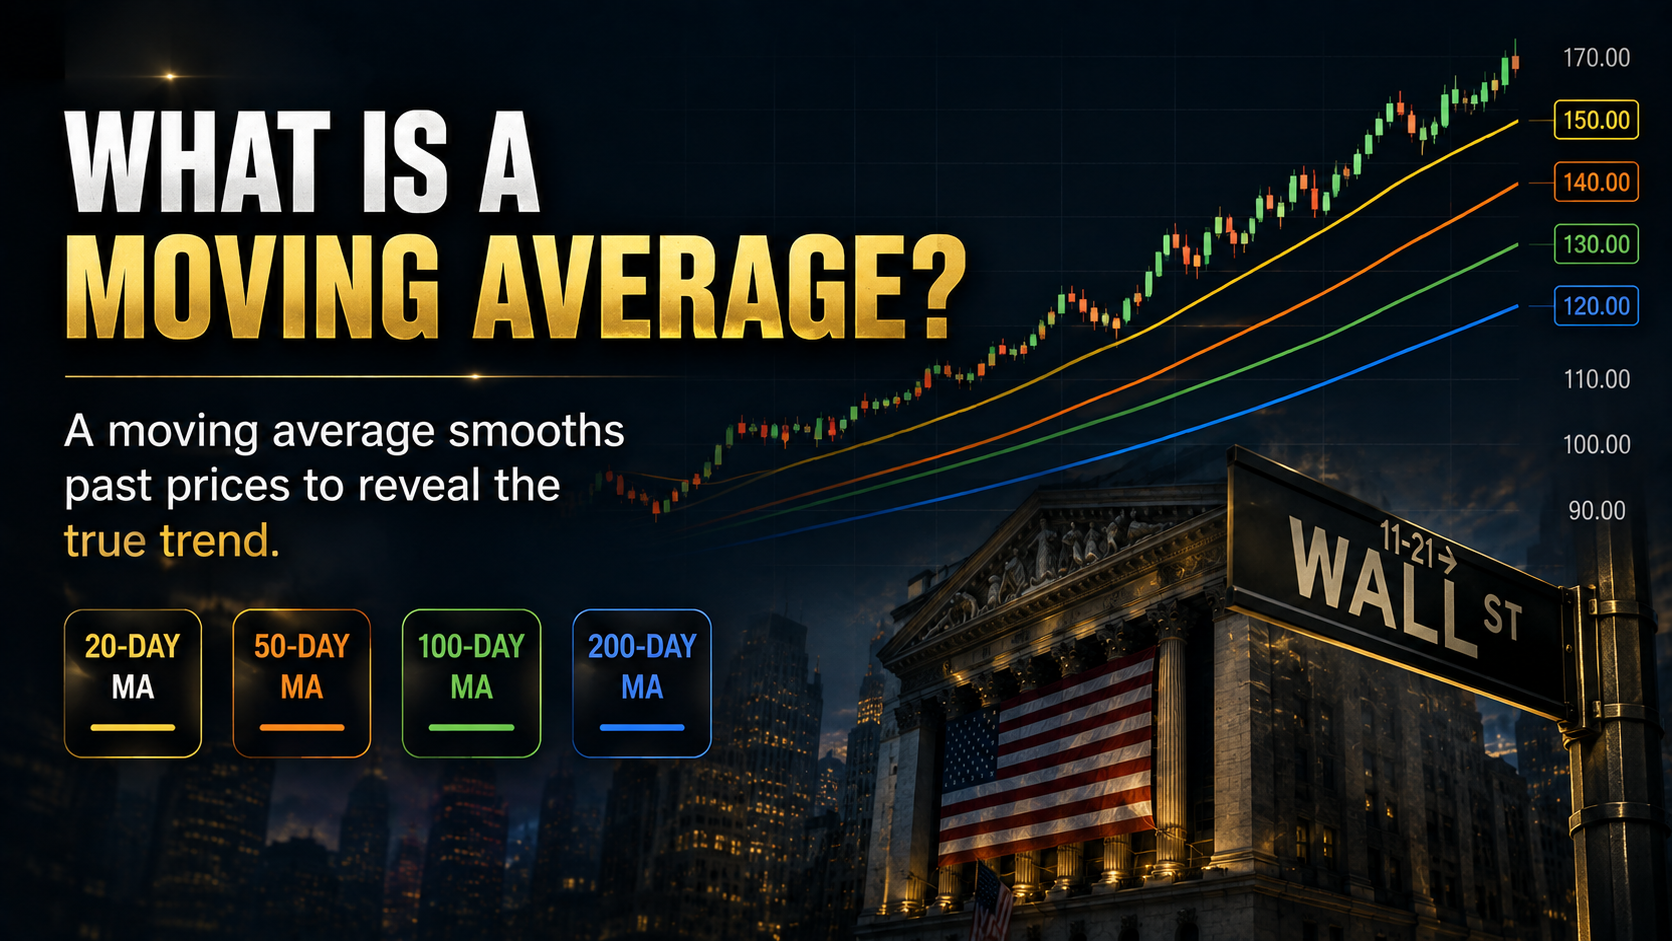
1. What Is a Moving Average?
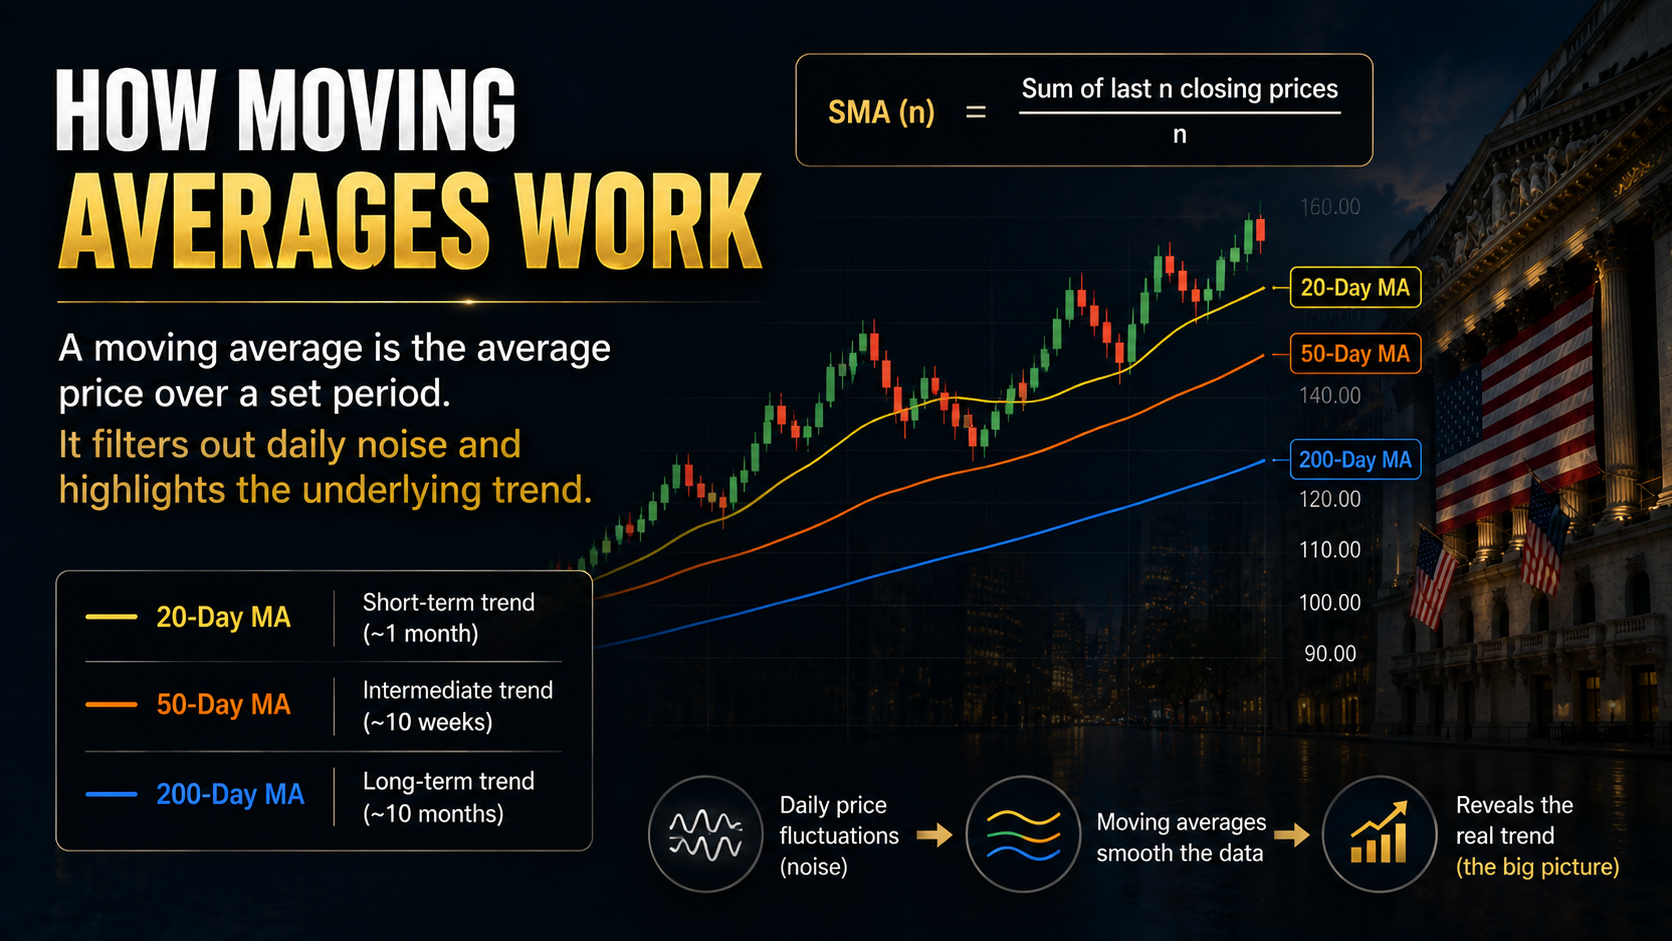
A Moving Average, or MA, calculates the average price of an asset over a specified period and plots that value continuously on a chart.
The simplest version is the Simple Moving Average (SMA).
For example
5-Day SMA = Sum of the last 5 closing prices ÷ 5
Suppose a stock closes at
| Trading Day | Closing Price |
| Day 1 | $100 |
| Day 2 | $102 |
| Day 3 | $104 |
| Day 4 | $103 |
| Day 5 | $106 |
The five-day moving average would be
($100 + $102 + $104 + $103 + $106) ÷ 5 = $103
On the next trading day, the oldest closing price drops out and the newest closing price enters the calculation.
That is why it is called a moving average.
Why Do Investors Use Moving Averages?
Financial markets are noisy.
A stock can rise or fall sharply because of an earnings report, an economic release, interest-rate expectations, options positioning, geopolitical developments, or simple short-term trading activity.
Looking only at daily price changes can make it difficult to distinguish a genuine trend from temporary volatility.
Moving averages smooth some of that noise.
Think of it this way
Price shows the waves. The moving average helps reveal the direction of the tide.
2. 20-Day, 50-Day, and 200-Day Moving Averages Explained
Different moving-average periods represent different investment horizons.
For U.S. investors, the 20-day, 50-day, and 200-day moving averages are particularly common.
| Moving Average | Approximate Period | Common Use |
| 5-Day MA | 1 trading week | Very short-term momentum |
| 20-Day MA | About 1 month | Short-term trend |
| 50-Day MA | About 10 weeks | Intermediate trend |
| 100-Day MA | About 5 months | Medium-to-long-term trend |
| 200-Day MA | About 10 months | Major long-term trend |
20-Day Moving Average
The 20-day moving average represents roughly one month of trading.
Because it reacts relatively quickly to price changes, it is useful for identifying shorter-term shifts in momentum.
50-Day Moving Average
The 50-day moving average is especially important in U.S. equity markets.
Investors often use it to determine whether an intermediate-term uptrend remains intact.
A stock repeatedly finding support around a rising 50-day average can indicate that buyers remain willing to step in during pullbacks.
But that does not mean the 50-day line itself causes the buying.
It is better understood as a reference point around which many market participants evaluate price and trend.
200-Day Moving Average
The 200-day moving average is one of the most closely watched long-term technical indicators in global markets.
When the S&P 500, Nasdaq Composite, or an individual stock trades above a rising 200-day moving average, investors often interpret the broader price trend as constructive.
Trading below a falling 200-day average may indicate a weaker long-term price environment.
However, there is no rule saying that an asset above its 200-day average must continue rising.
Moving averages describe trends. They do not guarantee outcomes.
3. How Does a Moving Average Work?
The most important relationship is between current price and historical average price.
Suppose a stock's 50-day moving average is $100.
If the stock is trading at $110, its current price is above its average closing price over the previous 50 trading sessions.
If it trades at $90, the current price is below that historical average.
This simple relationship can provide useful information about momentum.
When Price Is Above the Moving Average
A stock trading above a rising moving average generally indicates that recent prices are stronger than the historical average.
If earnings expectations and broader market conditions are also improving, this can be consistent with a healthy upward trend.
When Price Is Below the Moving Average
A stock below a declining moving average indicates that recent prices have weakened relative to their historical average.
Investors who purchased at higher prices may also become more willing to sell when the stock rebounds toward their previous entry levels.
This is one reason moving-average areas can sometimes behave like psychological support or resistance.
There is an important distinction, however.
A moving average is not the exact average cost basis of investors.
A standard SMA averages closing prices and does not calculate the actual volume-weighted acquisition cost of every shareholder.
Its value comes from showing the relationship between current price and historical price trends—not from precisely identifying where every investor bought.
4. Why Are Moving Averages Important to Investors?
Moving averages remain popular because they simplify several important questions.
Is the Market Trending Up or Down?
A single strong trading session does not necessarily create an uptrend.
Likewise, one sharp decline does not automatically end a bull market.
The direction of the moving average provides additional context.
A rising 200-day moving average tells a very different story from a falling 200-day moving average, even if both experience the same one-day rally.
Where Could Support or Resistance Develop?
During an established uptrend, investors may watch the 20-day or 50-day moving average during a pullback.
During a downtrend, those same averages may become areas where sellers return.
Again, the line itself has no magical power.
Support and resistance emerge because market participants make decisions around similar price references.
Are Different Time Horizons Moving in the Same Direction?
Comparing short-, intermediate-, and long-term averages can show whether different market horizons are becoming aligned.
This leads to concepts such as bullish alignment, bearish alignment, the Golden Cross, and the Death Cross.
MasterMind's Insight
Markets are not about predicting every turn. Moving averages are not crystal balls. They are navigation tools that help investors understand where price has been, where momentum is moving, and whether capital appears to be gaining or losing conviction.
5. Bullish and Bearish Moving Average Alignment
One moving average provides information.
Several moving averages viewed together provide additional context.
Bullish Alignment
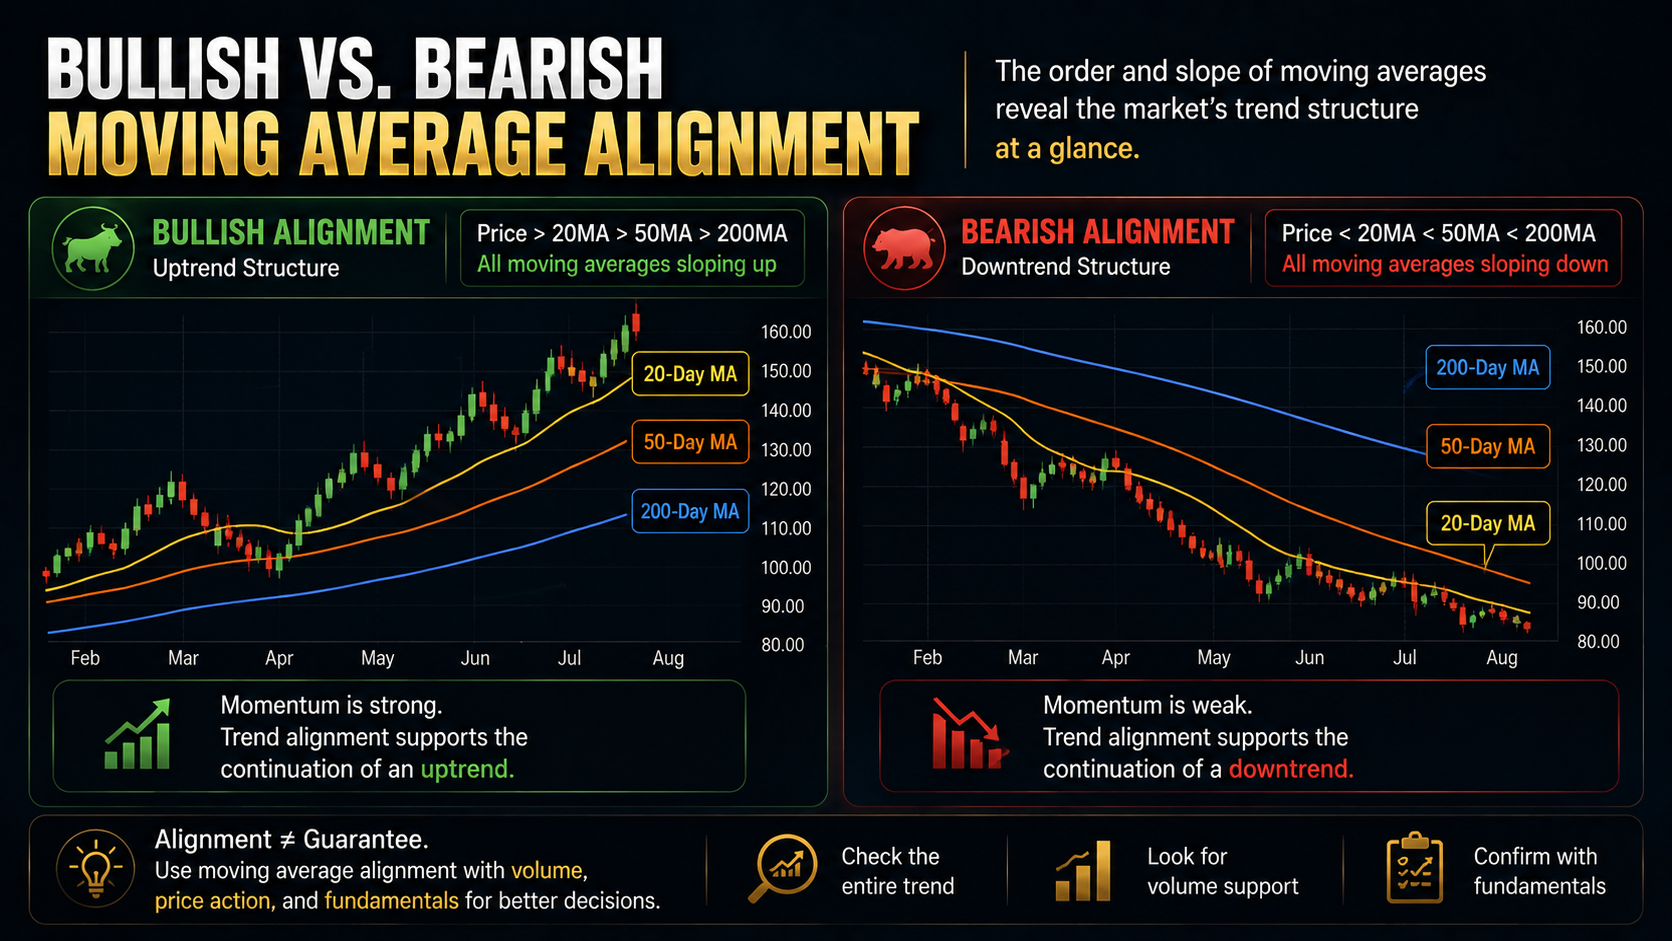
A strong bullish structure might look like
Price > 20-Day MA > 50-Day MA > 200-Day MA
If the averages themselves are also rising, short-, intermediate-, and long-term price trends are moving in the same direction.
This can be interpreted as a relatively strong trend structure.
But investors should be careful.
Perfect bullish alignment often develops after a substantial rally has already occurred.
It is evidence of an established trend, not proof that the asset is inexpensive or that another rally must follow.
Bearish Alignment
The opposite structure might look like
200-Day MA > 50-Day MA > 20-Day MA > Price
Here, shorter-term prices have weakened below longer-term averages.
During strong downtrends, rallies into declining moving averages can sometimes encounter selling pressure.
Again, this does not guarantee further declines.
The important question is whether the underlying trend is improving or deteriorating.
6. What Is a Golden Cross?
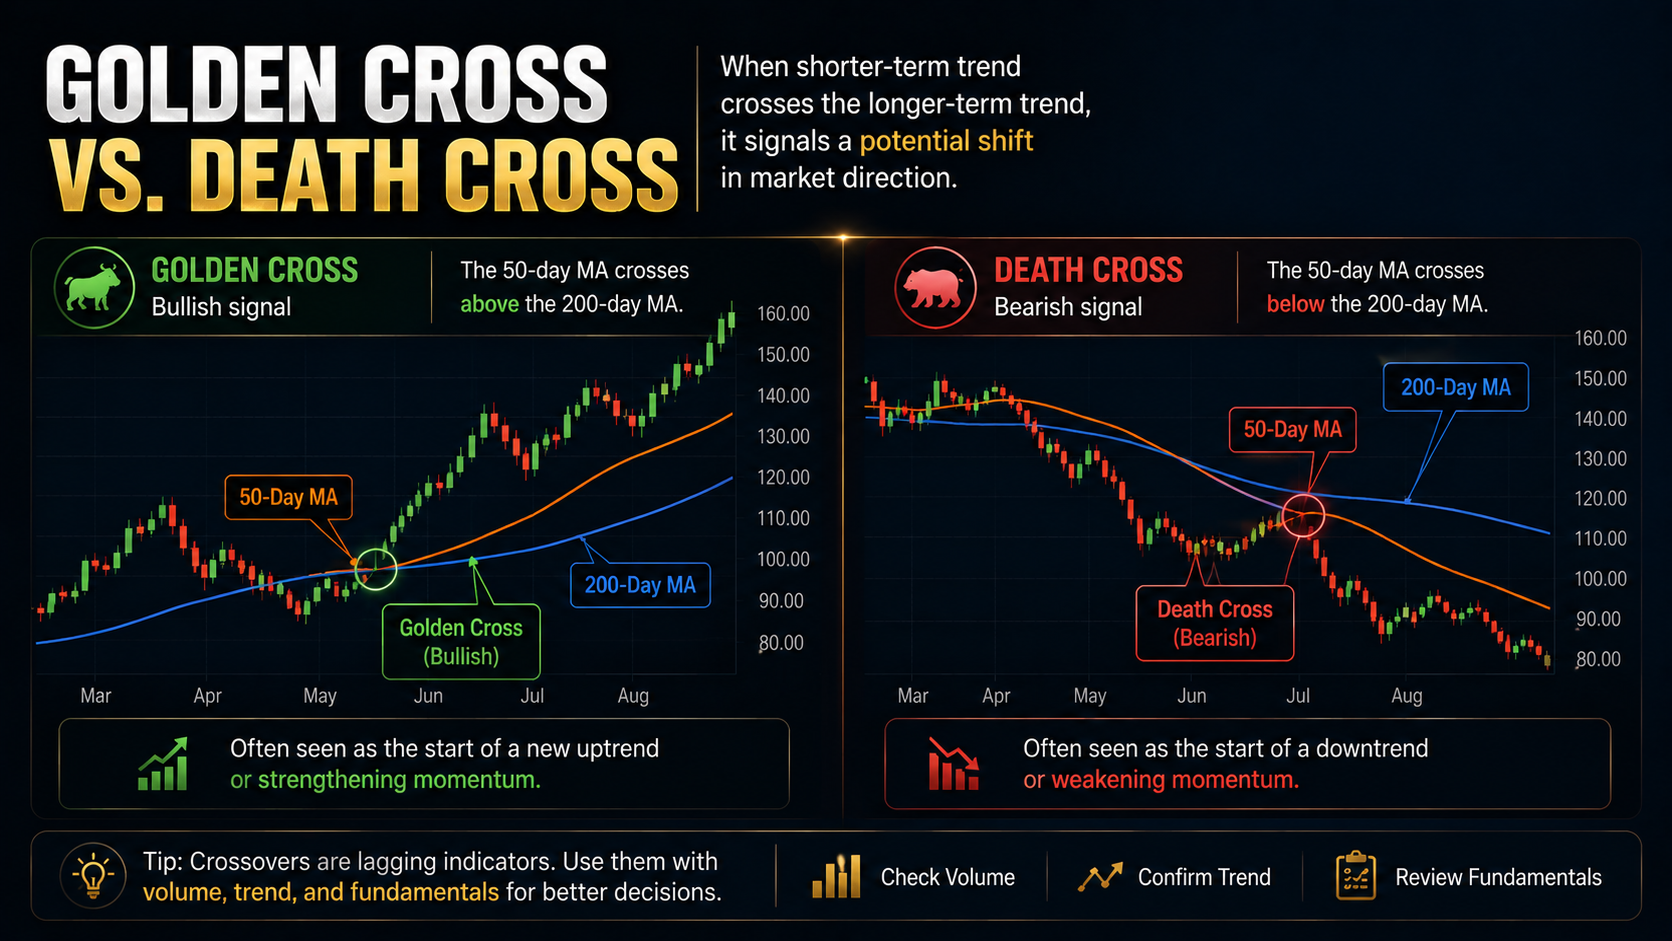
A Golden Cross occurs when a shorter-term moving average rises above a longer-term moving average.
In U.S. markets, one of the most widely discussed versions occurs when the
50-Day Moving Average crosses above the 200-Day Moving Average.
This indicates that intermediate-term prices have strengthened enough to pull the shorter average above the long-term trend.
It is commonly interpreted as a bullish technical development.
But there is a major limitation.
By the time a Golden Cross appears, prices may already have risen substantially.
That is because moving averages are lagging indicators.
The cross confirms what has already happened in price.
It does not know what happens next.
7. What Is a Death Cross?
A Death Cross is the opposite.
It typically refers to the
50-Day Moving Average crossing below the 200-Day Moving Average.
This indicates that intermediate-term price weakness has become significant enough to drag the shorter average below the long-term average.
Financial headlines often treat a Death Cross as a bearish warning.
But investors should avoid interpreting it as a guaranteed crash signal.
A market may form a Death Cross near the end of a decline and subsequently recover.
The correct interpretation is more modest
The recent price trend has weakened relative to the longer-term trend.
That is useful information—but it is not a forecast.
8. Why Volume Matters With Moving Averages
A moving-average breakout becomes more informative when investors also examine trading volume.
Imagine that a stock has spent months below its 200-day moving average and finally breaks above it.
There is a meaningful difference between
- a breakout occurring on unusually light trading, and
- a breakout accompanied by substantially increased market participation.
Higher volume indicates that more trading activity participated in the price move.
It still does not guarantee that the breakout will succeed, but it provides additional information about market conviction.
A useful way to think about the relationship is
Price shows direction. Volume helps show participation.
And neither should be analyzed in isolation from fundamentals.
9. Moving Averages Across Stocks, Bonds, the Dollar, Gold, and Bitcoin
Moving averages are not limited to individual stocks.
They can be applied to almost any liquid financial market.
| Asset | What Moving Averages Can Help Identify |
| U.S. Stocks | Short-, intermediate-, and long-term equity trends |
| Treasury Yields | Direction of interest-rate trends |
| U.S. Dollar | Momentum in the Dollar Index and currency markets |
| Gold | Long-term trend in monetary and defensive demand |
| Bitcoin | Major trend changes within a highly volatile market |
For example, investors can compare the S&P 500's long-term trend with the direction of Treasury yields.
If long-term yields are rising rapidly while expensive growth stocks begin losing their major moving averages, the chart may be reflecting a broader change in financial conditions.
That is where moving averages become more useful.
Instead of asking only
"Did the stock break the 50-day line?"
Ask
"What changed in the environment that caused investors to reprice this asset?"
10. The Biggest Limitation of Moving Averages: They Look Backward
Every moving average is calculated from historical prices.
This creates its greatest weakness: lag.
The market moves first.
The moving average follows.
A stock may rally substantially before a Golden Cross occurs.
Likewise, a major selloff may already have happened before a Death Cross appears.
Sideways Markets Can Create False Signals
Moving averages tend to work better as trend indicators when markets are actually trending.
During sideways markets, price can repeatedly move above and below the same moving average.
This can produce repeated crossovers that appear meaningful but fail to develop into sustained trends.
Moving Averages Cannot Tell You What a Business Is Worth
Perhaps the most important limitation is that a moving average tells investors almost nothing about intrinsic value.
It cannot tell you
- whether revenue is growing,
- whether margins are improving,
- whether debt is sustainable,
- whether free cash flow is strong,
- whether management is allocating capital effectively,
- or whether the stock is expensive relative to future earnings.
That is why technical indicators should not replace fundamental analysis.
A useful distinction is
Fundamentals help investors evaluate what they own. Moving averages help them understand how the market is currently pricing it.
11. What Should Investors Check When Using Moving Averages?
Rather than asking whether a stock simply crossed a particular line, investors can ask several deeper questions.
Where Is Price Relative to the Major Moving Averages?
This provides the initial snapshot of trend strength.
Are the Moving Averages Rising or Falling?
Slope matters.
A stock moving slightly above a rapidly declining 200-day average is different from a stock holding above a steadily rising one.
Are Short- and Long-Term Trends Aligned?
If the 20-day average is rising while the 200-day average continues to decline, investors may be seeing a short-term rebound rather than a confirmed long-term trend change.
Is Volume Confirming the Move?
Increasing participation around an important breakout or breakdown can provide additional context.
Are Fundamentals Improving?
Technical strength without improving earnings, cash flow, or business conditions deserves additional scrutiny.
What Are Interest Rates and Liquidity Doing?
This is especially important for U.S. equities.
Higher Treasury yields can increase discount rates and pressure the valuations of long-duration growth stocks.
Conversely, easier financial conditions can improve investors' willingness to hold risk assets.
The chart should therefore be viewed as the result of market forces, not as something separate from the economy.
12. What Do Wealthy and Long-Term Investors Look For?
Short-term traders may focus heavily on individual moving-average crossovers.
Long-term capital often has a different problem to solve.
It must survive.
Follow the Movement of Money
When Treasury yields rise sharply and financial conditions tighten, capital may leave speculative or highly valued assets and move toward cash, short-duration bonds, defensive businesses, or companies with stronger current cash flows.
When financial conditions improve, the opposite rotation can occur.
Eventually, these capital flows appear in prices—and therefore in moving averages.
The moving average is the footprint.
Capital allocation is the underlying force.
Focus on Cash Flow
A company can have a beautiful chart and weak economics.
It can also experience a major technical breakdown while its underlying business remains financially strong.
Long-term investors therefore need to distinguish between price deterioration and business deterioration.
If free cash flow remains healthy, the balance sheet is strong, and competitive advantages remain intact, a falling share price raises different questions than it would for a highly leveraged company with deteriorating earnings.
Think About Asset Survival
Easy-money environments can hide weaknesses.
When capital is cheap, even businesses with poor cash flow can sometimes survive for years.
When interest rates rise and liquidity becomes scarce, balance-sheet quality matters much more.
This is why investors should ask not only whether an asset is above or below its 200-day moving average, but whether the underlying business can survive a difficult economic cycle.
Keep a Long-Term Perspective
Long-term investing does not require identifying every market top and bottom.
A more useful framework is to ask
- Is this a short-term correction or a change in the long-term trend?
- Is only the stock price weakening, or are earnings and cash flow deteriorating too?
- Is capital leaving this company, sector, or asset class?
- Where is that capital moving instead?
- What are Treasury yields and financial conditions signaling?
- Can this business survive if my market expectations are wrong?
- Am I using the moving average as evidence—or simply to justify a decision I have already made?
For investors managing capital over decades, these questions matter far more than predicting tomorrow's closing price.
Investing is not only about maximizing upside. It is also about maintaining the ability to stay invested when conditions become difficult.

13. How Should Investors Use Moving Averages?
Moving averages are powerful because they simplify complicated price action.
The 20-day moving average can help identify shorter-term momentum.
The 50-day moving average provides a useful view of the intermediate trend.
The 200-day moving average helps investors put current prices into a broader long-term context.
Golden Crosses and Death Crosses can reveal changes in the relationship between different time horizons, while volume can provide additional information about participation behind those changes.
But none of these indicators can predict the future with certainty.
A Golden Cross does not guarantee a bull market.
A Death Cross does not guarantee a crash.
A break below the 200-day moving average does not destroy the intrinsic value of a profitable business.
The most useful approach is to combine price trend, moving-average slope, volume, earnings, cash flow, valuation, interest rates, and market liquidity.
The key lesson is simple
A moving average does not tell you where the market will go. It helps you understand where the market has been, how its trend is changing, and whether your investment thesis is moving with or against that trend.
In the end, the goal is not to predict every wave.
It is to understand the tide, manage risk, and remain financially strong enough to participate in the opportunities that follow.
This was MasterMind.
'[Global] Success Blueprints' 카테고리의 다른 글