What Is the Spot Rate? How It Affects Bond Prices and Asset Valuations


Hello, this is MasterMind.
When U.S. investors talk about interest rates, they are rarely talking about just one number.
There is the federal funds rate, Treasury yields, real yields, yield to maturity (YTM), forward rates, and another important concept known as the spot rate.
So what exactly is a spot rate?
Why would the interest rate used to value a cash flow one year from now be different from the rate used for a payment arriving ten years from now?
And why does this matter not only for Treasury bonds, but also for technology stocks, the U.S. dollar, gold, and other financial assets?
Understanding spot rates takes investors beyond simply asking whether "rates are going up or down." It reveals something more fundamental: how financial markets price money across time.
Once this concept becomes clear, several important ideas begin to connect
Spot Rates → Bond Valuation → Yield Curve → Forward Rates → Discount Rates → Asset Prices
That connection is what makes the spot rate an important building block for understanding modern financial markets.
One-Sentence Takeaway
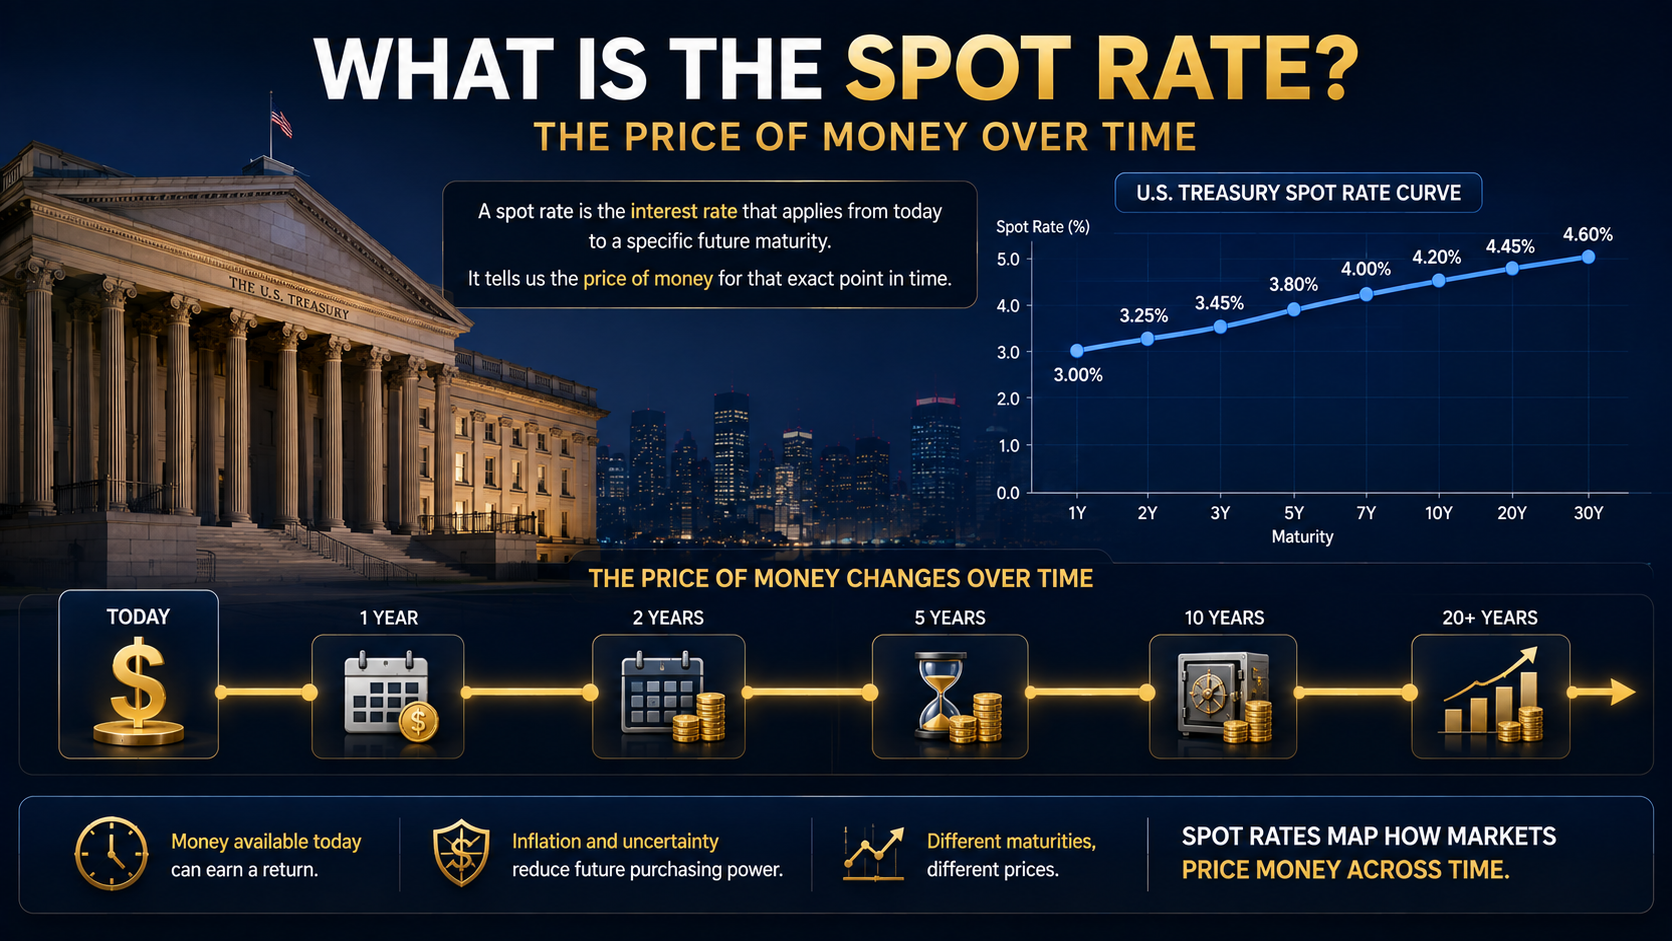
A spot rate is the interest rate that applies from today to a specific future maturity, providing a maturity-specific discount rate for converting future cash flows into present value.
Instead of applying one interest rate to every future payment, the spot-rate framework assigns a different rate depending on when that cash flow will be received.
What Is a Spot Rate?
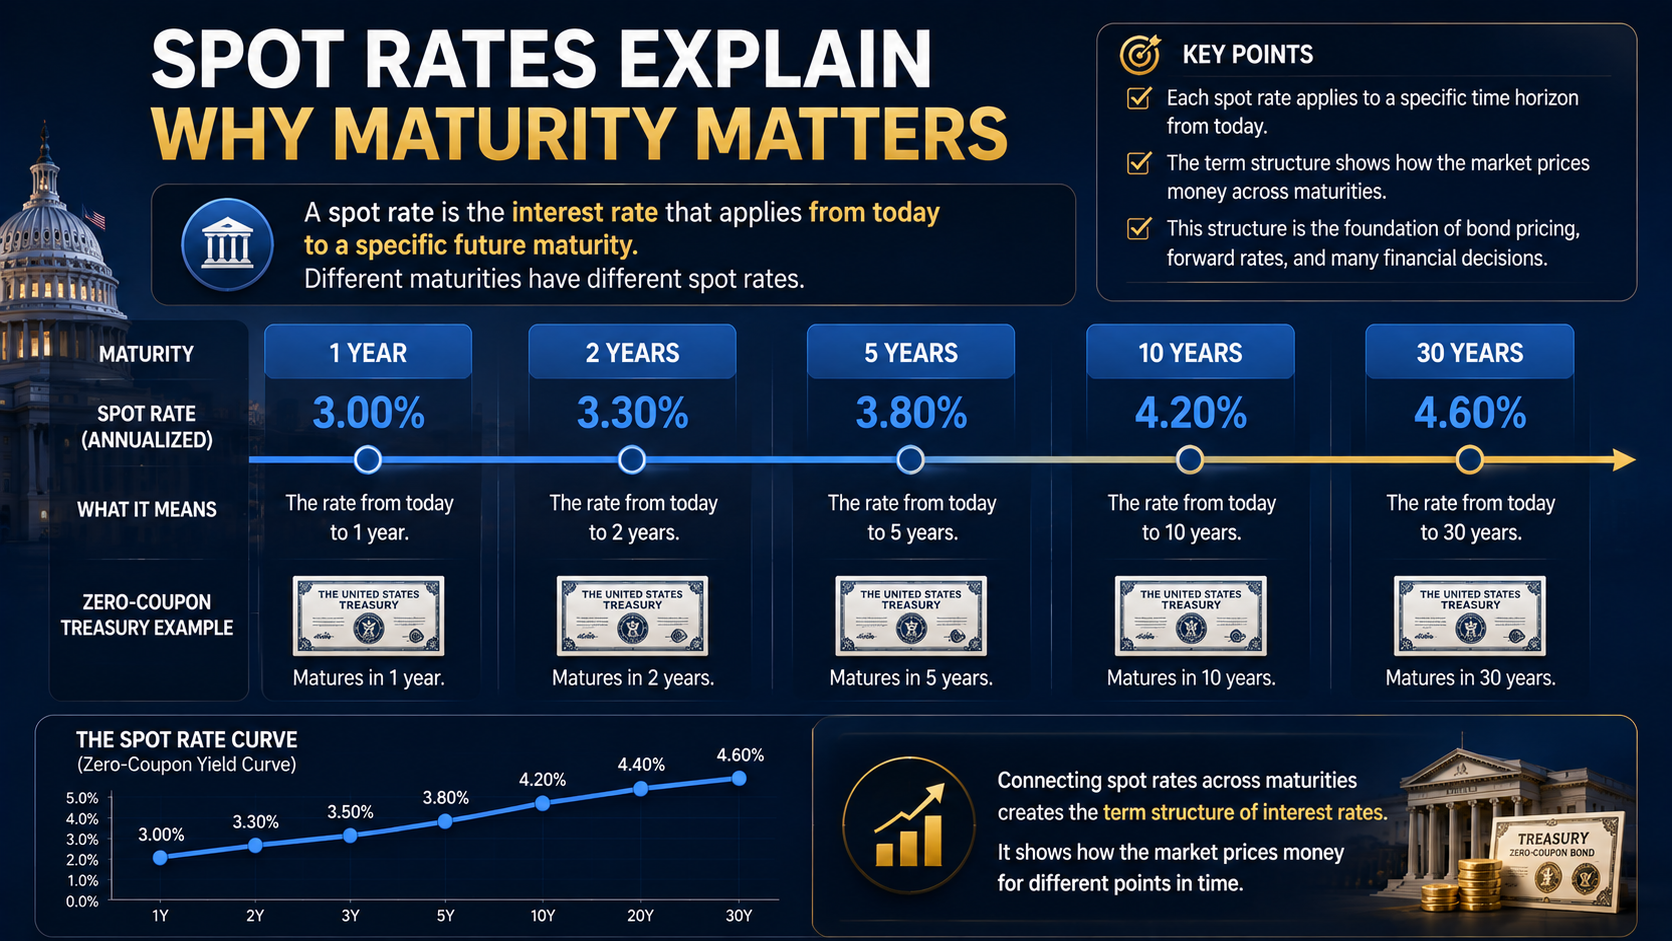
In fixed-income markets, a spot rate represents the annualized return associated with investing today until a specific future date.
The cleanest way to understand it is through a zero-coupon bond.
Unlike a traditional Treasury note or bond that pays periodic coupons, a zero-coupon security makes no intermediate interest payments. It is purchased below its face value and pays its face value at maturity.
Because there are no coupon payments to complicate the calculation, its yield provides a relatively clean representation of the interest rate for that specific maturity.
For example, imagine a hypothetical spot-rate curve like this
| Maturity | Spot Rate |
| 1 Year | 3.0% |
| 2 Years | 3.3% |
| 3 Years | 3.5% |
| 5 Years | 3.8% |
| 10 Years | 4.2% |
The one-year spot rate represents the rate from today through one year.
The five-year spot rate represents the annualized rate from today through five years.
The ten-year spot rate applies from today through ten years.
The key point is simple
There is no single spot rate. There is an entire structure of spot rates across different maturities.
Connecting those rates produces the spot-rate curve, also commonly called the zero-coupon yield curve.
It is essentially a map showing how the market prices money across time.
Spot Rate vs. Yield to Maturity: What Is the Difference?
One of the most common sources of confusion is the difference between a spot rate and a bond's yield to maturity (YTM).
They are related, but they are not interchangeable.
Yield to Maturity
Yield to maturity is the single discount rate that equates a bond's current market price with the present value of all its promised cash flows, assuming the bond is held to maturity and its payments occur as scheduled.
It summarizes an entire bond into one yield figure.
Spot Rate
Spot rates take a more granular approach.
Each future payment is discounted using the rate corresponding to its own maturity.
For example
- Cash flow in one year → 1-year spot rate
- Cash flow in two years → 2-year spot rate
- Cash flow in five years → 5-year spot rate
- Cash flow in ten years → 10-year spot rate
The distinction can be summarized this way
| Yield to Maturity | Spot Rate | |
| Number of rates | One per bond | One for each maturity |
| Main purpose | Summarize a bond's yield | Discount maturity-specific cash flows |
| Cash-flow treatment | One common internal rate | Different rate for each payment date |
| Yield-curve analysis | Less precise | Fundamental |
| Forward-rate calculation | Not the primary input | Core building block |
A useful analogy is that YTM gives you the average speed of an entire trip, while spot rates tell you the appropriate rate for each segment of the journey.
How Spot Rates Work: The Time Value of Money
The fundamental idea behind spot rates is the time value of money.
A dollar today is not economically identical to a dollar received ten years from now.
Money available today can earn a return. Inflation can reduce future purchasing power. Interest rates can change. Economic conditions can deteriorate.
Future cash flows therefore need to be translated into today's dollars.
That process is known as discounting.
In simplified form
Present Value = Future Cash Flow ÷ (1 + Discount Rate)^Time
Spot rates allow investors to apply the appropriate discount rate to each point in time.
A Simple Bond Valuation Example
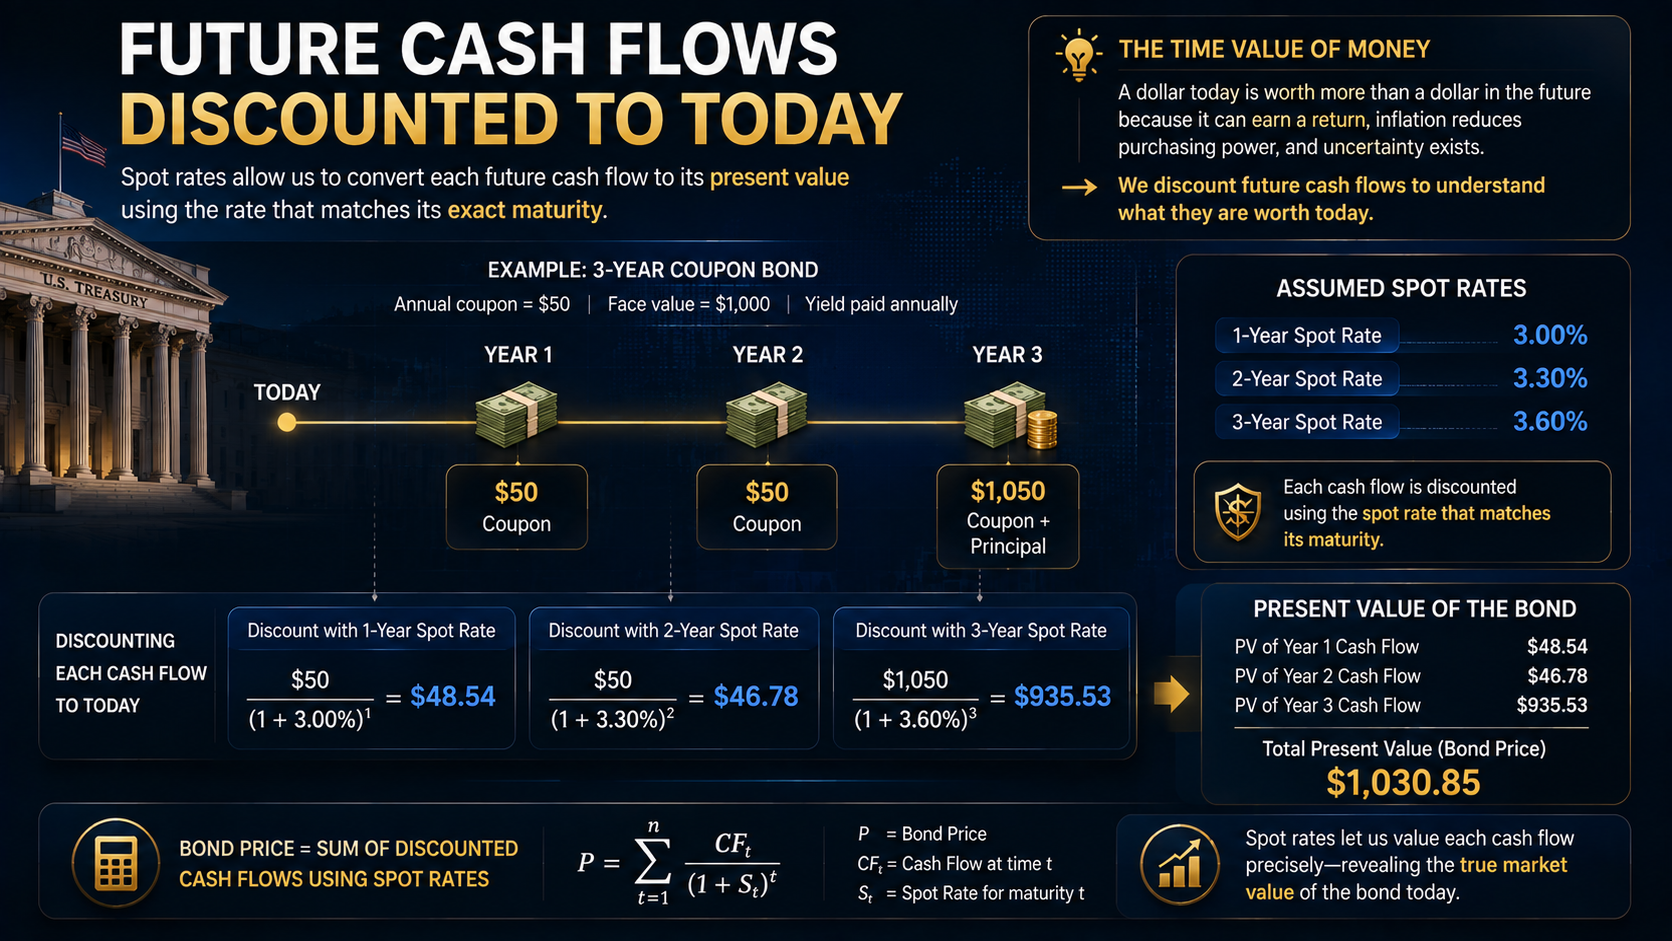
Suppose a three-year bond pays $50 in annual coupons and returns $1,000 of principal at maturity.
Its cash flows would be
- Year 1: $50
- Year 2: $50
- Year 3: $1,050
Rather than discounting all three payments using a single rate, a spot-rate valuation can apply
- 1-year spot rate to the first $50
- 2-year spot rate to the second $50
- 3-year spot rate to the final $1,050
Conceptually
P = C/(1+S₁) + C/(1+S₂)² + (C+F)/(1+S₃)³
Where
- P = bond price
- C = coupon payment
- F = face value
- S₁ = 1-year spot rate
- S₂ = 2-year spot rate
- S₃ = 3-year spot rate
This reveals an important insight about bonds.
A coupon-paying bond can effectively be viewed as a collection of separate future cash flows bundled into one security.
Spot rates allow investors to value those cash flows individually.
Why Higher Spot Rates Reduce Present Value
The relationship between interest rates and asset values becomes much easier to understand through discounting.
Imagine receiving $1,000 ten years from now.
If the appropriate discount rate is low, that future $1,000 is worth relatively more today.
If the discount rate rises substantially, its present value falls.
Therefore, all else equal
Higher Spot Rates → Higher Discount Rates → Lower Present Value → Downward Pressure on Asset Prices
And
Lower Spot Rates → Lower Discount Rates → Higher Present Value → Support for Asset Prices
This principle is most direct in bond valuation, but the same basic logic appears throughout finance.
Stocks, real estate, private businesses, and many other investments derive at least part of their value from expected future cash flows.
The further into the future those cash flows occur, the more sensitive their present value can become to changes in discount rates.
How Is the Spot-Rate Curve Constructed?
There is a practical problem.
Markets do not necessarily provide a perfectly liquid zero-coupon Treasury security for every maturity investors may want to analyze.
As a result, analysts can derive a zero-coupon curve from the prices of coupon-paying securities.
One common technique is called bootstrapping.
The basic logic is sequential.
First, the shortest available maturity is used to determine the short-term spot rate.
Once that rate is known, it can be used to discount the first cash flow of a longer-maturity bond.
That makes it possible to solve for the next spot rate.
The process continues across maturities
Market Bond Prices → Short-Term Spot Rate → Next Maturity → Longer Maturities → Spot-Rate Curve
Think of it as climbing a ladder one rung at a time.
The resulting curve provides a maturity-by-maturity representation of discount rates.
Why Are Spot Rates Important?
Spot rates matter because much of finance ultimately comes down to one question
What are future cash flows worth today?
Bond Valuation
Different bond payments arrive at different dates.
Spot rates provide maturity-specific discount rates that can be used to value those payments individually.
Term Structure of Interest Rates
Connecting spot rates across maturities produces a curve that helps investors understand how interest rates vary across time horizons.
Forward Rates
Spot rates can be used to calculate interest rates implied between two future dates.
These are known as forward rates.
Interest-Rate Derivatives
Discount curves are also fundamental to the valuation of swaps and many other fixed-income derivatives.
Broader Asset Valuation
In equity valuation, corporate finance, and M&A analysis, Treasury rates and other market rates often serve as inputs to the discount-rate framework.
The exact discount rate used for a company is not simply the Treasury spot rate because equity and corporate cash flows carry additional risk. But the risk-free term structure provides an important starting point.
That distinction matters.
The spot-rate curve is not the final discount rate for every asset. It is part of the foundation from which risk-adjusted discount rates are built.
What Is the Spot-Rate Curve?
When spot rates for different maturities are plotted together, they form a spot-rate curve.
Its shape contains useful information about the market's pricing of interest rates across time.
Upward-Sloping Curve
Long-term spot rates are higher than short-term rates.
This can reflect several forces, including expected future short-term rates, inflation uncertainty, growth expectations, and term premiums.
Flat Curve
The difference between short- and long-term rates becomes relatively small.
This can emerge when markets are transitioning between different economic or monetary-policy regimes.
Inverted Curve
Short-term rates exceed longer-term rates.
An inverted Treasury yield curve has historically received significant attention as a recession indicator because it can emerge when markets expect monetary policy to become easier in the future as economic growth slows.
However, investors should avoid treating inversion as a mechanical recession countdown.
Yield curves reflect multiple forces, and their information should be interpreted alongside economic data, inflation trends, credit conditions, and monetary policy.
The deeper lesson is
Do not just ask whether interest rates are high or low. Ask which part of the curve is moving and why.
Spot Rates and Forward Rates
Once investors understand spot rates, forward rates become much easier to understand.
A spot rate applies from today to a future date.
A forward rate refers to a rate implied today for a borrowing or investment period that begins in the future.
For example, if the one-year and two-year spot rates are known, investors can calculate the one-year rate implied for the period beginning one year from today.
Under a simplified annual compounding assumption
(1 + 2-Year Spot Rate)² = (1 + 1-Year Spot Rate) × (1 + 1Y1Y Forward Rate)
This relationship allows investors to extract information about how the market is pricing future interest-rate periods.
But there is an important caveat.
An implied forward rate is not a guaranteed forecast of the future federal funds rate.
Forward rates can incorporate more than expectations for monetary policy. Term premiums, risk compensation, liquidity conditions, and supply-demand dynamics can also affect market pricing.
It is better to think of forward rates as showing the rate structure embedded in today's market prices, rather than as a perfect prediction of tomorrow.
How Spot-Rate Changes Affect Financial Markets
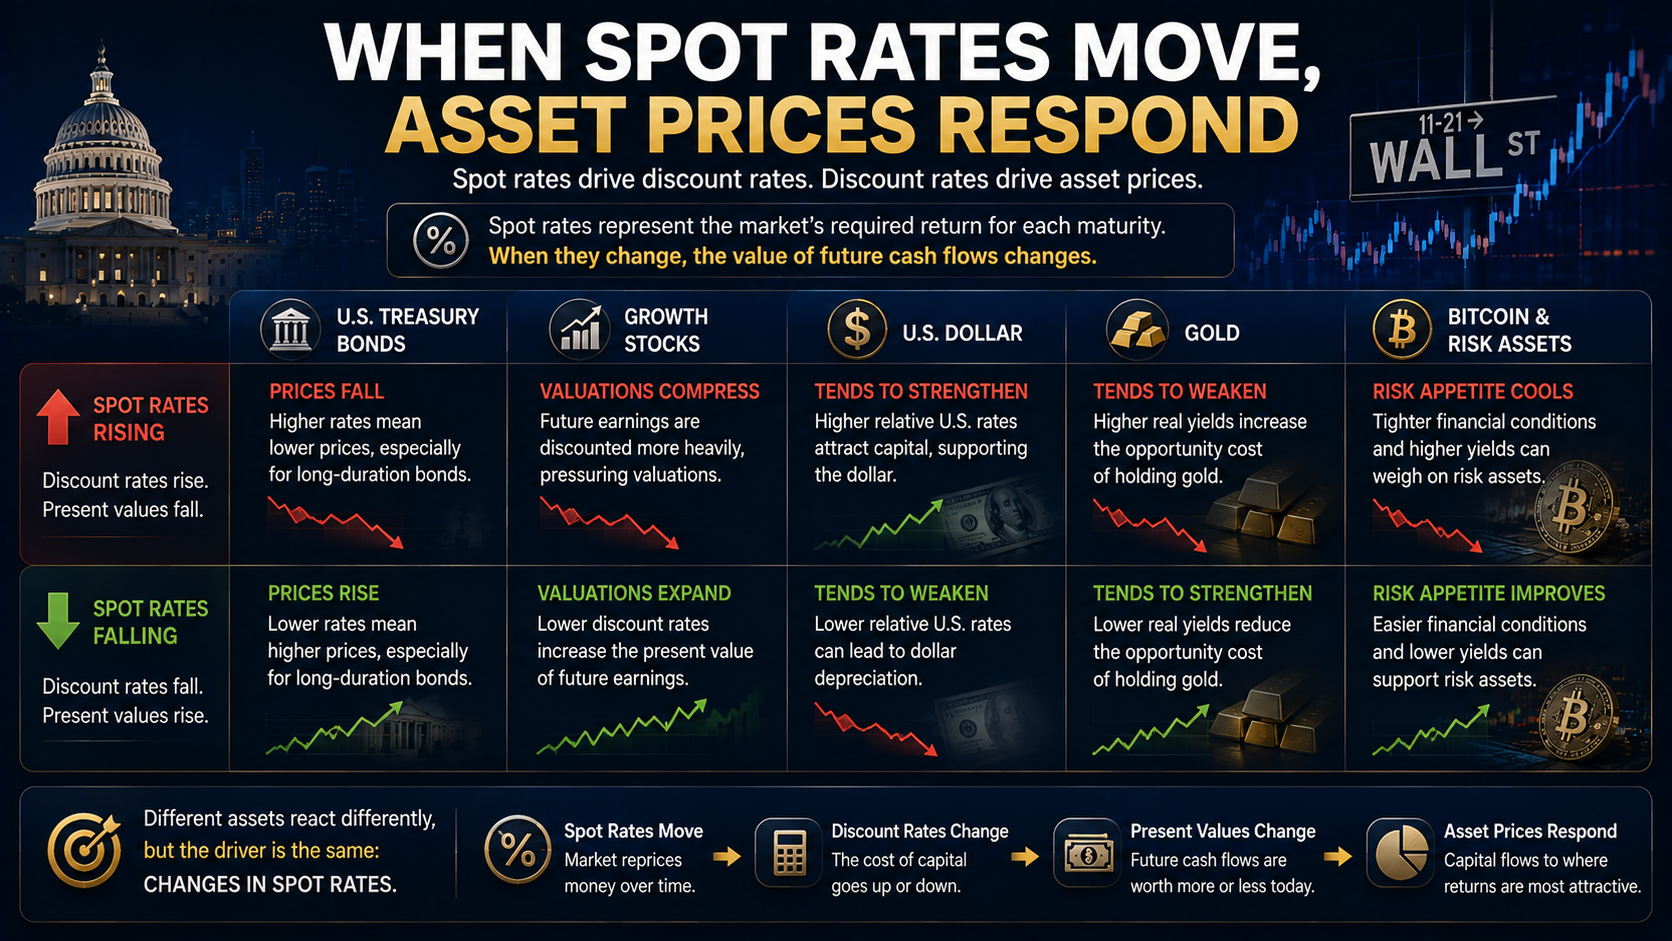
Changes in the interest-rate curve can influence multiple asset classes.
| Asset Class | Higher Rate Environment | Lower Rate Environment | Main Mechanism |
| Long-Term Treasuries | Price pressure | Price support | Greater duration sensitivity |
| Growth & Technology Stocks | Valuation pressure | More supportive valuations | Long-dated cash flows |
| Value & Dividend Stocks | May be relatively defensive | Relative appeal can change | More near-term cash flows |
| U.S. Dollar | Can benefit from higher relative U.S. rates | Can face pressure from lower relative rates | Cross-border capital flows |
| Gold | Higher real yields can be a headwind | Lower real yields can be supportive | Opportunity cost |
| Bitcoin & Risk Assets | Tight liquidity can be challenging | Easier liquidity can be supportive | Financial conditions and risk appetite |
These are tendencies, not mechanical rules.
The reason rates are moving can matter as much as the direction.
Why Growth Stocks Are Sensitive to Long-Term Rates
The connection between long-term interest rates and growth stocks is especially important for U.S. equity investors.
Many high-growth companies are valued on the assumption that a large portion of their profits will arrive years into the future.
That gives their valuations a relatively long-duration characteristic.
When long-term discount rates rise, those distant cash flows are discounted more heavily.
A company's revenue outlook may remain unchanged, yet its valuation multiple can still contract because the market's required return has increased.
This helps explain why technology stocks can sometimes react sharply to moves in long-term Treasury yields even when the Federal Reserve has not changed its policy rate.
The opposite can occur when long-term rates decline.
However, falling yields are not automatically bullish.
If Treasury yields are collapsing because investors fear a severe recession, lower discount rates may be offset by expectations for weaker earnings.
Again, the cause of the rate move matters.
What Investors Should Watch
1. Look Beyond "Rates Are Up"
A move in the 2-year Treasury can carry a different message from a move in the 10-year or 30-year Treasury.
Shorter maturities tend to be more closely linked to the expected path of Federal Reserve policy, while longer maturities can also reflect growth, inflation, fiscal expectations, and term premiums.
The entire term structure matters.
2. Watch How the Curve Changes
A steepening curve can occur for very different reasons.
Long-term rates may rise faster than short-term rates, or short-term rates may fall faster than long-term rates.
Both produce a steeper curve, but the economic interpretation can be very different.
3. Understand Duration Risk
Long-duration assets are generally more sensitive to changes in discount rates.
This applies most directly to bonds, but the concept can also help investors understand why companies whose valuations depend heavily on distant future earnings can be especially rate-sensitive.
4. Separate Nominal Rates From Real Rates
A rise in nominal Treasury yields does not always tell the full story.
Investors should consider whether the move reflects higher inflation expectations, higher real yields, or both.
For assets such as gold and long-duration equities, movements in real interest rates can be particularly important.
5. Watch the Speed of the Move
Markets can sometimes handle high interest rates better than they can handle rapidly changing interest rates.
If high yields are already widely expected, asset prices may have adjusted.
A sudden repricing of the rate path, however, can force investors to reassess valuations across bonds, equities, real estate, and credit simultaneously.
What Do Wealthy Investors and Institutions Look For?
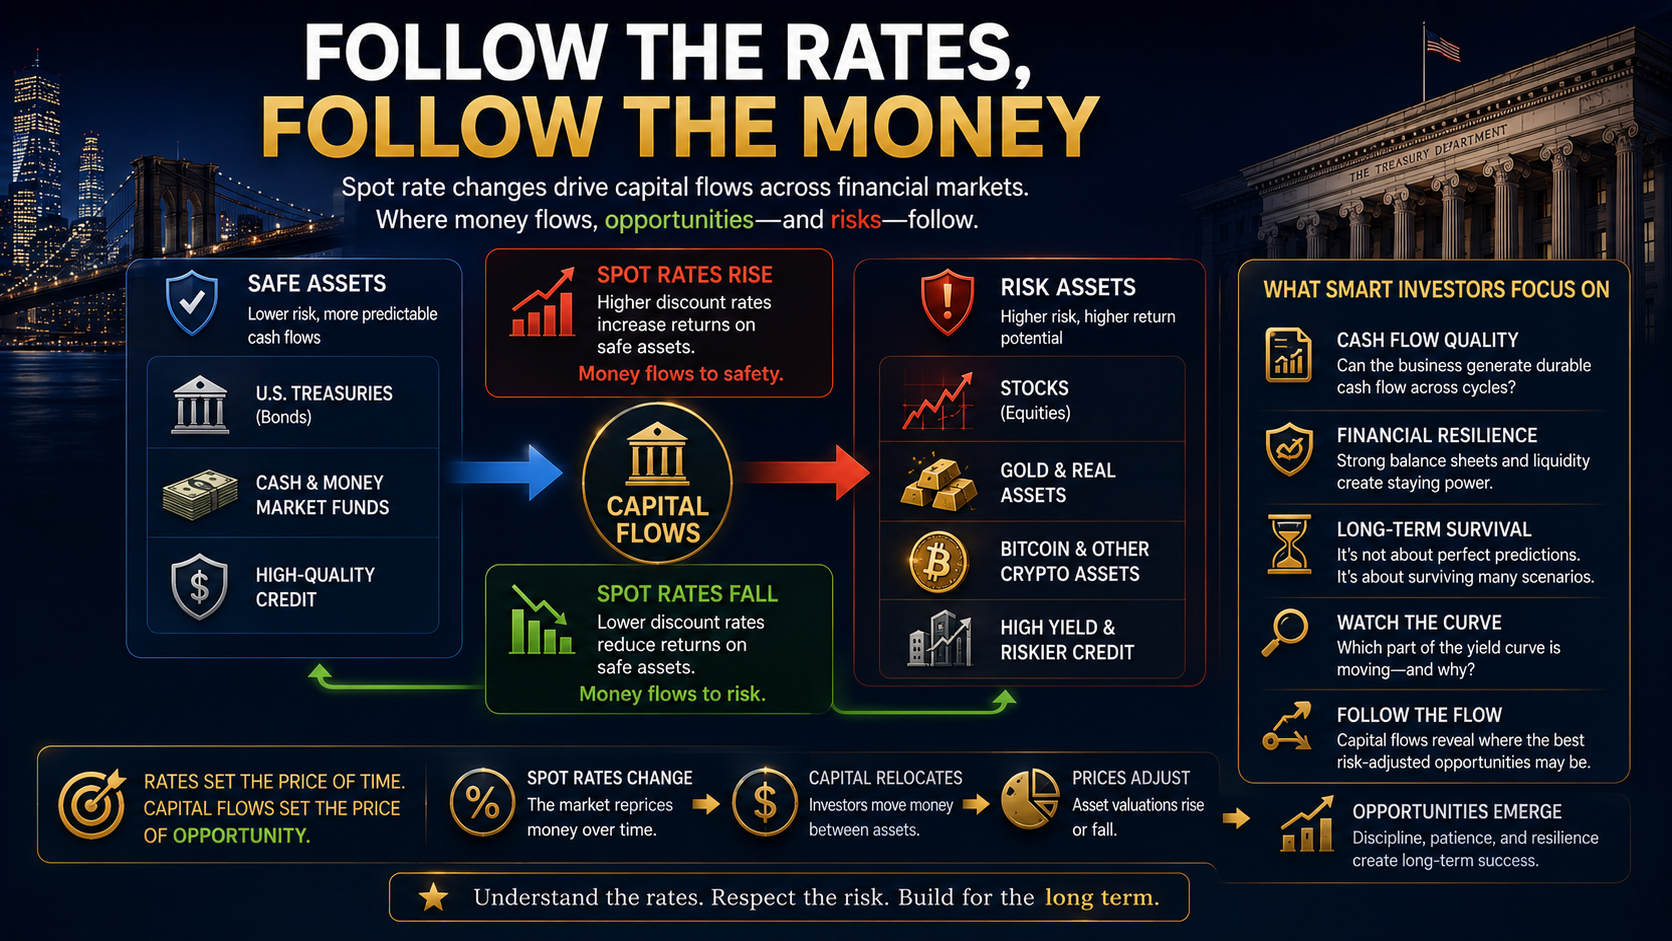
Large investors are not simply asking whether the S&P 500 finished higher today.
They are asking how changes in the cost of capital are altering the relative attractiveness of different assets.
The Movement of Money
When Treasury securities offer attractive yields with relatively low credit risk, investors demand more compensation before taking additional risk elsewhere.
The hurdle rate for owning equities, lower-quality credit, or other risky assets effectively becomes higher.
When risk-free rates fall substantially, investors may become more willing to move further out on the risk spectrum in search of returns.
Interest rates therefore influence the price investors demand for taking risk.
Cash Flow
Higher discount rates make the quality and timing of cash flows increasingly important.
A business with impressive revenue growth but weak free cash flow can look very different when capital becomes expensive.
Investors may place greater value on companies capable of generating durable free cash flow without relying heavily on external financing.
Asset Resilience
A prolonged high-rate environment can expose fragile balance sheets.
Companies carrying large amounts of debt may eventually have to refinance at significantly higher borrowing costs.
Businesses with strong balance sheets, substantial liquidity, and durable cash generation generally have more room to survive difficult financing conditions.
Strong markets often highlight growth.
Difficult markets reveal financial resilience.
The Long-Term Perspective
A falling asset price does not automatically mean an asset has become cheap.
Higher discount rates can justify lower valuations.
At the same time, a high-quality asset can sometimes experience a major valuation reset even though its long-term cash-generating ability remains intact.
The key question is therefore not simply
"How far has the price fallen?"
A better question is
"After applying today's required return, does this asset still offer durable cash flow and sufficient financial strength?"
Investors can ask themselves
Can the companies I own continue generating cash if interest rates remain higher for longer?
Does my expected return depend on actual cash generation, or mostly on future multiple expansion?
Which maturity on the Treasury curve is moving most aggressively?
Is capital moving toward safety or toward risk?
Can my portfolio survive if the interest-rate environment turns out very differently from what the market currently expects?
These questions matter because successful long-term investing does not require predicting every Federal Reserve decision.
Prediction is useful, but survival is essential.
The Bigger Picture: Spot Rates and the Price of Time
At first glance, spot rates may seem like a technical concept reserved for bond traders.
But once the pieces are connected, they reveal a much broader financial framework
Spot Rates → Discounting → Bond Prices → Yield Curve → Forward Rates → Required Returns → Asset Valuations
All of these concepts ultimately revolve around the same question
What is a future dollar worth today?
Financial markets answer that question continuously.
The spot-rate curve provides one of the clearest representations of how that answer changes depending on time.
Conclusion
A spot rate is the interest rate applying from today to a specific future maturity and is a fundamental building block for discounting future cash flows.
Understanding spot rates makes it easier to understand why bond prices change, how the zero-coupon yield curve is constructed, how forward rates are derived, and why movements in Treasury yields can affect equity valuations and broader financial conditions.
Rather than simply reacting to headlines saying that "rates rose" or "rates fell," investors can ask more useful questions
Which maturity moved?
Why did it move?
How does that change the present value of future cash flows?
And ultimately
Where is capital moving as a result?
Interest rates are more than numbers on a financial screen.
They are the price of money across time, and the spot-rate curve is one of the market's clearest maps of that price.
The goal is not to perfectly predict the next move in interest rates. It is to understand how changing discount rates affect cash flows, valuations, capital allocation, and the ability of an investment to survive different economic environments.
In investing, prediction matters less than survival.
This was MasterMind.
'[Global] Success Blueprints' 카테고리의 다른 글