Nasdaq Market Close August 20, 2026: Walmart Slumps, Treasury Yields Rebound, Top 5 Gainers and Losers


U.S. stocks finished broadly lower on Thursday, August 20, 2026, as renewed pressure from long-term Treasury yields collided with fresh concerns about the strength of the American consumer.
The Nasdaq Composite fell 1.00%, while the S&P 500 declined 0.87% and the Dow Jones Industrial Average lost 1.32%.
Walmart (WMT) became one of the biggest focal points of the session after U.S. comparable-store sales growth came in below Wall Street expectations. At the same time, Treasury yields rebounded after the previous session's decline, putting renewed valuation pressure on technology and other long-duration growth stocks.
But the index declines tell only part of the story.
The more important question for investors is
Where did the money actually go?
While consumer stocks and expensive growth names faced selling pressure, capital selectively moved toward crypto-related equities, energy producers, and individual companies backed by stronger earnings catalysts.
Consumer-spending concerns and rebounding Treasury yields pressured growth stocks, while capital selectively rotated toward crypto, energy, and companies able to demonstrate tangible earnings momentum.
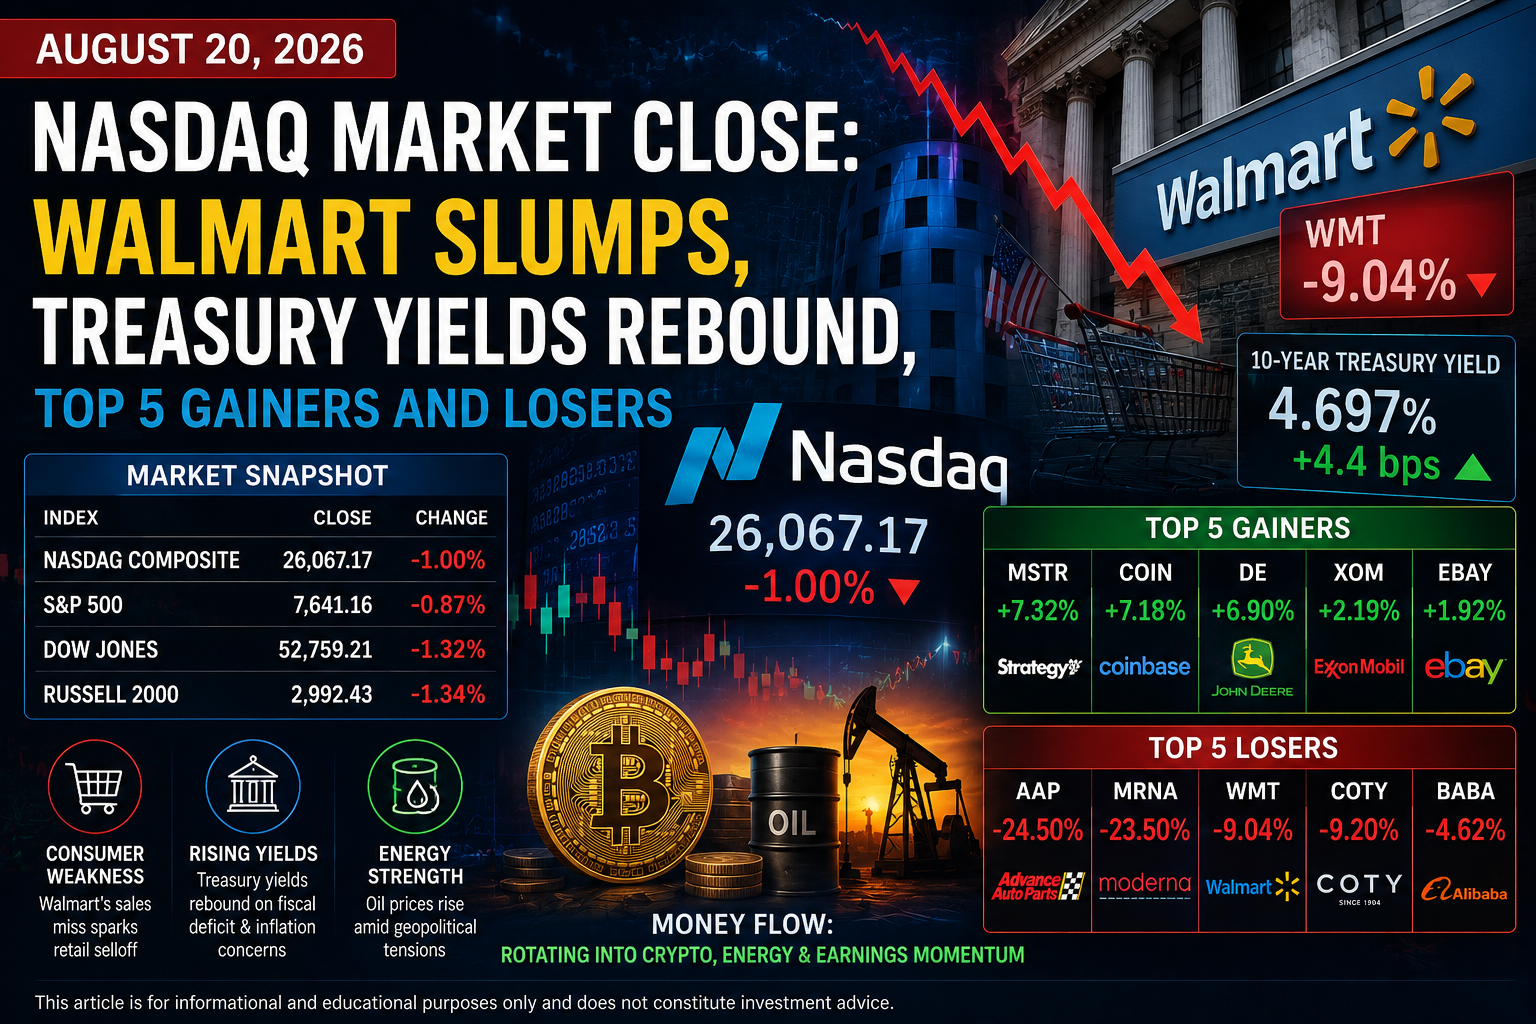
1. U.S. Stock Market Close
| Index | Close | Change |
| Nasdaq Composite | 26,067.17 | -1.00% |
| S&P 500 | 7,641.16 | -0.87% |
| Dow Jones Industrial Average | 52,759.21 | -1.32% |
| Russell 2000 | 2,992.43 | -1.34% |
The weakness was not limited to a handful of mega-cap technology stocks.
On the Nasdaq, 3,217 stocks declined while only 1,672 advanced, meaning decliners outnumbered advancers by nearly two to one. Breadth was similarly negative on the NYSE.
That distinction matters.
A 1% Nasdaq decline driven almost entirely by several mega-cap stocks would tell investors one story. A decline accompanied by widespread weakness across thousands of stocks tells a different one.
Thursday was clearly closer to the second scenario.
Small caps also underperformed, with the Russell 2000 falling 1.34%, indicating that higher yields and risk reduction were affecting more than just highly valued technology companies.
Trading activity, however, did not suggest outright panic. Approximately 9.61 billion shares changed hands across U.S. exchanges, well below the roughly 16.64 billion-share average over the previous 20 sessions.
The session therefore looked more like broad risk reduction than indiscriminate capitulation.
At the sector level, Consumer Staples and Health Care both declined 1.93%, while Consumer Discretionary fell about 1.8%. Energy bucked the trend with a 0.4% gain, providing one of the clearest signs of sector rotation during the session.
2. Why Did the Nasdaq Fall?
Three forces mattered most.
First: Walmart Raised Questions About the U.S. Consumer
Walmart (WMT) reported U.S. comparable-store sales growth of 2.6%, significantly below Wall Street expectations of roughly 3.8%.
It represented the company's weakest comparable-sales growth in years.
The important distinction is that Walmart did not cut its full-year outlook.
In fact, management raised its full-year sales-growth forecast from 3.5%-4.5% to 4%-5% and increased its full-year EPS guidance.
The market's concern centered instead on weaker-than-expected U.S. comparable sales and a third-quarter earnings outlook that fell short of expectations.
That changes the interpretation.
This was not
Walmart cuts its outlook → Walmart collapses
It was closer to
U.S. comparable sales miss expectations
↓
Questions emerge about consumer spending
↓
Higher gasoline and living costs remain a burden
↓
Retail stocks weaken
↓
Broader risk sentiment deteriorates
That distinction is particularly important for U.S. investors because Walmart is more than just another retailer.
Its enormous customer base makes the company one of the market's most useful real-time windows into household spending behavior.
The selloff subsequently spread to other retailers, including Costco (COST), Dollar Tree (DLTR), and Albertsons (ACI).
Second: Treasury Yields Rebounded Despite Expanded Buybacks
The Treasury Department had provided temporary relief to the bond market by doubling the maximum size of buybacks for longer-dated Treasuries, including 10-, 20-, and 30-year securities, from $2 billion to as much as $4 billion.
Long-term yields initially fell.
The relief didn't last.
Investors quickly returned their attention to the more structural forces affecting the Treasury market
Large fiscal deficits
↓
Heavy Treasury issuance
↓
Inflation uncertainty
↓
Higher term premium
↓
Higher long-term yields
↓
Pressure on equity valuations
The fact that long-term yields rebounded so quickly after the Treasury's announcement may be more important than the announcement itself.
It suggests investors remain focused on America's longer-term fiscal and inflation risks rather than temporary improvements in Treasury-market liquidity.
Third: Oil Became an Inflation Variable Again
Oil prices rose amid renewed Middle East geopolitical tensions and concerns about potential supply disruptions.
Brent crude climbed more than 2% toward $93 per barrel, while U.S. crude moved above $87.
Higher oil prices affect equities through two separate channels.
For households
Higher gasoline prices → lower disposable income → less spending elsewhere
For financial markets
Higher energy prices → inflation pressure → higher-for-longer rate expectations → higher bond yields
That made oil particularly relevant Thursday because it reinforced both of the market's primary concerns: consumer pressure and interest-rate risk.
3. The 10-Year Treasury Yield Is Back Near 4.7%
U.S. 10-Year Treasury yield: approximately 4.697%
U.S. 30-Year Treasury yield: approximately 5.237%
Long-term yields rebounded after the previous session's Treasury-buyback-driven decline, bringing the 10-year yield back toward the psychologically important 4.7% area.
The 30-year yield also moved back above 5.2%.
Why does this matter so much for the Nasdaq?
Growth stocks derive a larger portion of their valuation from profits expected many years into the future.
Those future cash flows must be discounted back into today's dollars.
When long-term interest rates rise
Discount rate rises
↓
Present value of future earnings falls
↓
High-multiple stocks become harder to justify
This is why a technology company's earnings outlook can remain completely unchanged while its stock price falls simply because Treasury yields rise.
For Nasdaq investors, the bond market remains one of the most important markets to watch.
4. Five Notable Stocks on the Upside
These are not simply the five stocks with the largest percentage gains.
The selection focuses on market relevance, trading activity, identifiable catalysts, company size, and what each move tells us about broader capital flows.
| Company | Business | Move | Trading Signal | Key Catalyst |
| Strategy (MSTR) | Bitcoin treasury / software | +7% range | Heavy interest | Bitcoin rally and crypto-policy optimism |
| Coinbase (COIN) | Cryptocurrency exchange | +7% range | Heavy interest | Regulatory clarity expectations |
| Deere (DE) | Agriculture & construction equipment | +6.9% | Earnings-driven | Earnings beat and improved profit outlook |
| Energy producers | Oil & gas | Sector strength | Broad participation | Rising crude prices |
| eBay (EBAY) | E-commerce marketplace | +1.92% | Above-average volume | Relative strength in weak tape |
Strategy (MSTR): +7% Range
Strategy remains one of the equity market's highest-beta proxies for Bitcoin because of the enormous amount of Bitcoin held on its balance sheet.
Bitcoin's move back above $70,000 therefore provided a direct catalyst.
But there was also a second factor: U.S. crypto policy.
President Donald Trump pushed lawmakers to advance the Clarity Act, legislation intended to establish clearer rules governing digital assets and regulatory jurisdiction.
The combination of higher Bitcoin prices and potentially lower regulatory uncertainty created a powerful setup for crypto-sensitive equities.
Coinbase (COIN): +7% Range
Coinbase benefited from the same two forces.
The first was higher crypto prices.
The second—and arguably more important for the company's long-term valuation—was the possibility of clearer U.S. digital-asset regulation.
Regulatory clarity could eventually encourage broader institutional participation, additional product development, and greater trading activity.
Thursday's move therefore looked broader than a simple Bitcoin bounce.
It reflected capital moving through the crypto ecosystem, from Bitcoin itself into exchanges, corporate holders, and other crypto-linked equities.
Deere (DE): +6.9%
Deere delivered one of the session's most interesting earnings reactions.
The company reported adjusted earnings of $5.10 per share, exceeding Wall Street expectations, while raising the lower end of its 2026 net-income outlook.
But another detail deserves attention.
Deere's construction and forestry revenue increased 18% year over year, supported partly by infrastructure projects and construction related to AI data centers.
This highlights an increasingly important second-order AI trade.
AI spending does not stop with GPUs.
Data centers require
land → construction → heavy equipment → electricity → cooling → networking → servers
Deere provides evidence that the AI capital-expenditure boom is increasingly showing up in industries far removed from semiconductor manufacturing.
Energy Producers
Energy was one of the rare positive S&P 500 sectors, rising about 0.4% while the broader market declined.
That matters more than the performance of any single oil company.
Higher crude prices lifted expectations for cash flow across producers, creating a sector-wide tailwind.
In other words, this looked less like an isolated company story and more like actual sector rotation into energy.
eBay (EBAY): +1.92%
eBay gained 1.92% during a session when the broader consumer complex struggled.
Trading volume reached approximately 5.6 million shares, above its roughly 3.9 million-share 50-day average.
The percentage move itself was not extraordinary.
The relative strength was.
When the broader market and many consumer names are falling, a stock rising on above-average volume deserves more attention than its headline percentage change might suggest.
5. Five Notable Stocks on the Downside
| Company | Business | Move | Trading Signal | Primary Catalyst |
| Advance Auto Parts (AAP) | Auto-parts retail | -24.5% | Heavy selling | Lower full-year sales outlook |
| Moderna (MRNA) | mRNA biotechnology | -23.5% | Extreme volatility | Profit-taking after 177% surge |
| Walmart (WMT) | Retail | -9.2% | Heavy large-cap selling | U.S. comparable-sales miss |
| Coty (COTY) | Beauty products | -9.2% | Earnings-driven | Weak quarterly outlook |
| Alibaba (BABA) | E-commerce, cloud & AI | -4.6% | Earnings-driven | AI spending pressure on profits |
Advance Auto Parts (AAP): -24.5%
Advance Auto Parts sells automotive replacement parts and maintenance products.
Shares collapsed after management lowered its full-year sales outlook.
The move matters because auto maintenance sits in an interesting part of consumer spending.
Drivers eventually have to replace worn parts, but many repairs and maintenance expenses can still be postponed.
Combined with Walmart's weaker comparable-sales growth, Advance Auto Parts added another data point suggesting that some American households may be becoming more selective about spending.
Moderna (MRNA): -23.5%
Moderna fell sharply one day after an extraordinary 177% rally tied to positive Phase 3 news involving its personalized cancer-vaccine program with Merck.
The following session's decline therefore needs context.
This was not necessarily evidence that the original clinical catalyst had suddenly disappeared.
Instead, the stock was digesting an almost unprecedented one-day repricing.
The move is better viewed as extreme post-catalyst volatility and profit-taking than as evidence of a new biotechnology-sector problem.
Walmart (WMT): -9.2%
Walmart was arguably the most important individual stock of the day.
Its U.S. comparable-store sales increased 2.6%, missing expectations of approximately 3.8%.
Importantly, Walmart actually raised its full-year outlook.
The company increased its full-year sales-growth forecast to 4%-5% from 3.5%-4.5% and also raised its annual EPS guidance.
The problem was that investors were focused on weakening near-term U.S. sales momentum and a third-quarter earnings outlook below expectations.
The real question raised by Walmart was therefore not
"Is Walmart's business collapsing?"
It was
"Are higher living costs and gasoline prices beginning to meaningfully alter U.S. consumer behavior?"
That question explains why the stock's decline spread beyond Walmart itself.
Coty (COTY): -9.2%
Coty owns a portfolio of global beauty brands.
Shares fell after the company issued weaker-than-expected quarterly profit guidance and declined to provide a full-year outlook.
Combined with Walmart's results, Coty's reaction showed how little tolerance investors currently have for reduced earnings visibility in consumer-facing businesses.
Alibaba (BABA): -4.6%
Alibaba offered perhaps the day's most important lesson for AI investors.
Revenue increased, and AI-related cloud sales grew approximately 45%.
Yet net income plunged 75% as the company aggressively increased spending on AI infrastructure. Capital expenditures rose roughly 75% to around 67.68 billion yuan.
That creates an important distinction.
The market is not necessarily rejecting Alibaba's AI strategy.
It is asking
How long will it take before massive AI investment produces enough earnings and cash flow to justify the spending?
That question is increasingly relevant across the entire AI ecosystem.
6. Where Did the Money Go?
Thursday's market cannot be summarized simply as "risk-off."
Investors reduced risk broadly, but they still aggressively bought areas with clear catalysts.
Money Left Consumer Stocks
Walmart fell 9.2%, Advance Auto Parts dropped 24.5%, and Coty declined 9.2%.
Other retailers also weakened.
Consumer Staples declined 1.93%, while Consumer Discretionary fell approximately 1.8%.
The common thread was
Higher living costs + higher energy costs + weaker spending momentum
This was one of the clearest areas of capital outflow.
Money Moved Into the Crypto Value Chain
Crypto presented the opposite picture.
Bitcoin rally
↓
Regulatory clarity expectations
↓
Coinbase
↓
Strategy
↓
Broader crypto-linked equities
Both Coinbase and Strategy rallied more than 7%.
The important point is that the move expanded beyond Bitcoin itself.
That makes Thursday's action more accurately described as capital spreading through the crypto value chain.
Energy Provided a Genuine Sector Rotation Signal
Energy gained about 0.4% while the S&P 500 fell 0.87%.
That relative strength is significant.
Rising oil prices hurt many businesses through higher costs, but they directly improve revenue expectations for producers.
Thursday therefore produced a classic two-sided energy shock
Higher oil → pressure on consumers and transportation
while simultaneously
Higher oil → stronger earnings expectations for producers
The fact that energy remained positive during a broad market selloff makes the sector one of the clearest examples of actual capital rotation.
AI Is Splitting Into Spending and Monetization
The contrast between Alibaba and Deere may be even more interesting.
Alibaba showed
AI spending ↑ → AI revenue ↑ → profits ↓
Deere showed
AI infrastructure spending ↑ → construction activity ↑ → equipment demand ↑ → earnings benefit
The message for investors is increasingly clear.
The market is beginning to differentiate between companies that are spending money on AI and companies that are already earning money because somebody else is spending on AI.
That distinction could become increasingly important as the AI investment cycle matures.
7. MasterMind's Insight
First: Watch the Bond Market's Reaction, Not Just Treasury Policy
The Treasury Department expanded long-duration bond buybacks.
Yields initially fell.
Then they rebounded.
That sequence matters.
It suggests that improving Treasury-market liquidity alone may not be enough to offset investor concerns about fiscal deficits, bond supply, inflation, and term premium.
For Nasdaq investors, the key question is therefore not simply what the Treasury or Federal Reserve announces.
It is
What does the bond market do afterward?
Second: Market Breadth Was Weaker Than the Index Suggested
The Nasdaq fell 1%, but declining stocks outnumbered advancing stocks by almost two to one.
That tells investors the weakness extended far beyond several mega-cap names.
In a market dominated by enormous index weights, watching the index alone can obscure what is happening underneath the surface.
A better framework is
Index performance + market breadth + trading volume
Together, those three indicators provide a much clearer picture of underlying market health.
Third: AI Is Moving From the Spending Phase to the ROI Question
Alibaba and Deere tell two different AI stories.
Alibaba's AI-related revenue grew rapidly, but enormous capital spending weighed heavily on profits.
Deere benefited because data-center construction was already generating demand for physical equipment.
The market's AI framework may therefore be evolving from
"How much are you spending on AI?"
to
"How much revenue, margin, and cash flow is that AI spending producing?"
That is a much higher bar.
And it could increasingly separate AI winners from AI stocks that merely carry the label.
8. What to Watch Next
The next U.S. trading session is Friday, August 21.
1. August Flash U.S. PMI
The preliminary August U.S. manufacturing and services PMIs are scheduled for
9:45 a.m. ET
For U.S. investors, the most important reaction may not be the S&P 500's first move.
Watch the 10-year Treasury yield.
A stronger-than-expected PMI could reinforce higher-for-longer interest-rate expectations, while weaker data could ease some bond-market pressure.
2. The 10-Year Treasury at 4.7%
The 4.7% area has become one of the market's key short-term levels.
A sustained move above it could create additional valuation pressure on high-multiple growth stocks.
A move back below it could provide some relief.
3. Retail Stocks After Walmart
Walmart's decline spread into other retailers.
If that selling continues, investors may increasingly interpret Walmart's results as evidence of a broader consumer slowdown rather than a company-specific miss.
4. Crypto Trading Volume
Coinbase and Strategy both produced major gains.
The next test is whether those gains are accompanied by sustained trading activity.
If volume remains elevated across multiple crypto-linked stocks, the move would provide stronger evidence of genuine capital rotation rather than a one-session policy trade.
5. Energy Follow-Through
Energy managed to rise during a broad market decline.
If crude remains elevated and producers continue outperforming, Thursday's move could develop from defensive relative strength into a more durable sector rotation.
Today's Bottom Line
Walmart's U.S. sales miss and rebounding long-term Treasury yields pushed the Nasdaq down 1.00%, but beneath the index decline, capital selectively rotated away from consumer and high-valuation stocks toward crypto, energy, and companies demonstrating tangible earnings benefits from current investment trends.
Final Thoughts
August 20 was not simply a day when "the Nasdaq fell 1%."
Treasury yields rebounded despite the government's expanded bond-buyback program. Walmart raised questions about the strength of U.S. household spending. Rising oil prices simultaneously increased inflation concerns and strengthened the earnings outlook for energy producers.
Yet money did not disappear from the market entirely.
It moved.
Crypto-related equities attracted capital after a combination of higher Bitcoin prices and improving regulatory expectations. Energy outperformed as crude prices climbed. Deere demonstrated how AI infrastructure spending can generate earnings opportunities far beyond the semiconductor industry.
That is why daily market analysis should move through the following sequence
Indexes → Interest Rates → Volume → Sectors → Individual Stocks
The important question is not simply whether the Nasdaq rose or fell.
It is
Why did it move, where did trading activity concentrate, which sectors lost capital, and where did that money go next?
This was MasterMind, designing the path to success.
Disclaimer: This article is for market information and educational purposes only and does not constitute a recommendation to buy or sell any security.
'[Global] Success Blueprints' 카테고리의 다른 글