What Is the Debt-to-Equity Ratio? How to Calculate It and Why It Matters


Hello, this is MasterMind.
If a company’s revenue and operating income keep growing every year, does that automatically make it financially strong?
Not necessarily.
Some companies can report impressive growth right up until a recession, credit crunch, or higher interest rates expose a weakness that was hiding on the balance sheet: too much debt relative to their ability to support it.
A business does not fail simply because earnings decline for a quarter or even a year. The more dangerous moment comes when it cannot meet its financial obligations, refinance maturing debt, or generate enough cash to keep operating.
That is why understanding the debt-to-equity ratio is an important part of fundamental analysis.
It does more than tell investors how much debt a company carries. When combined with cash flow, interest coverage, and debt maturity data, it can help reveal how much financial pressure a business may be able to withstand when economic conditions deteriorate.
Key Takeaway
The debt-to-equity ratio measures a company’s liabilities or debt relative to shareholders’ equity, but the number alone does not determine whether a company is financially healthy. Investors should also examine the type of debt, cash generation, interest obligations, maturity schedule, and industry structure.

What Is the Debt-to-Equity Ratio?
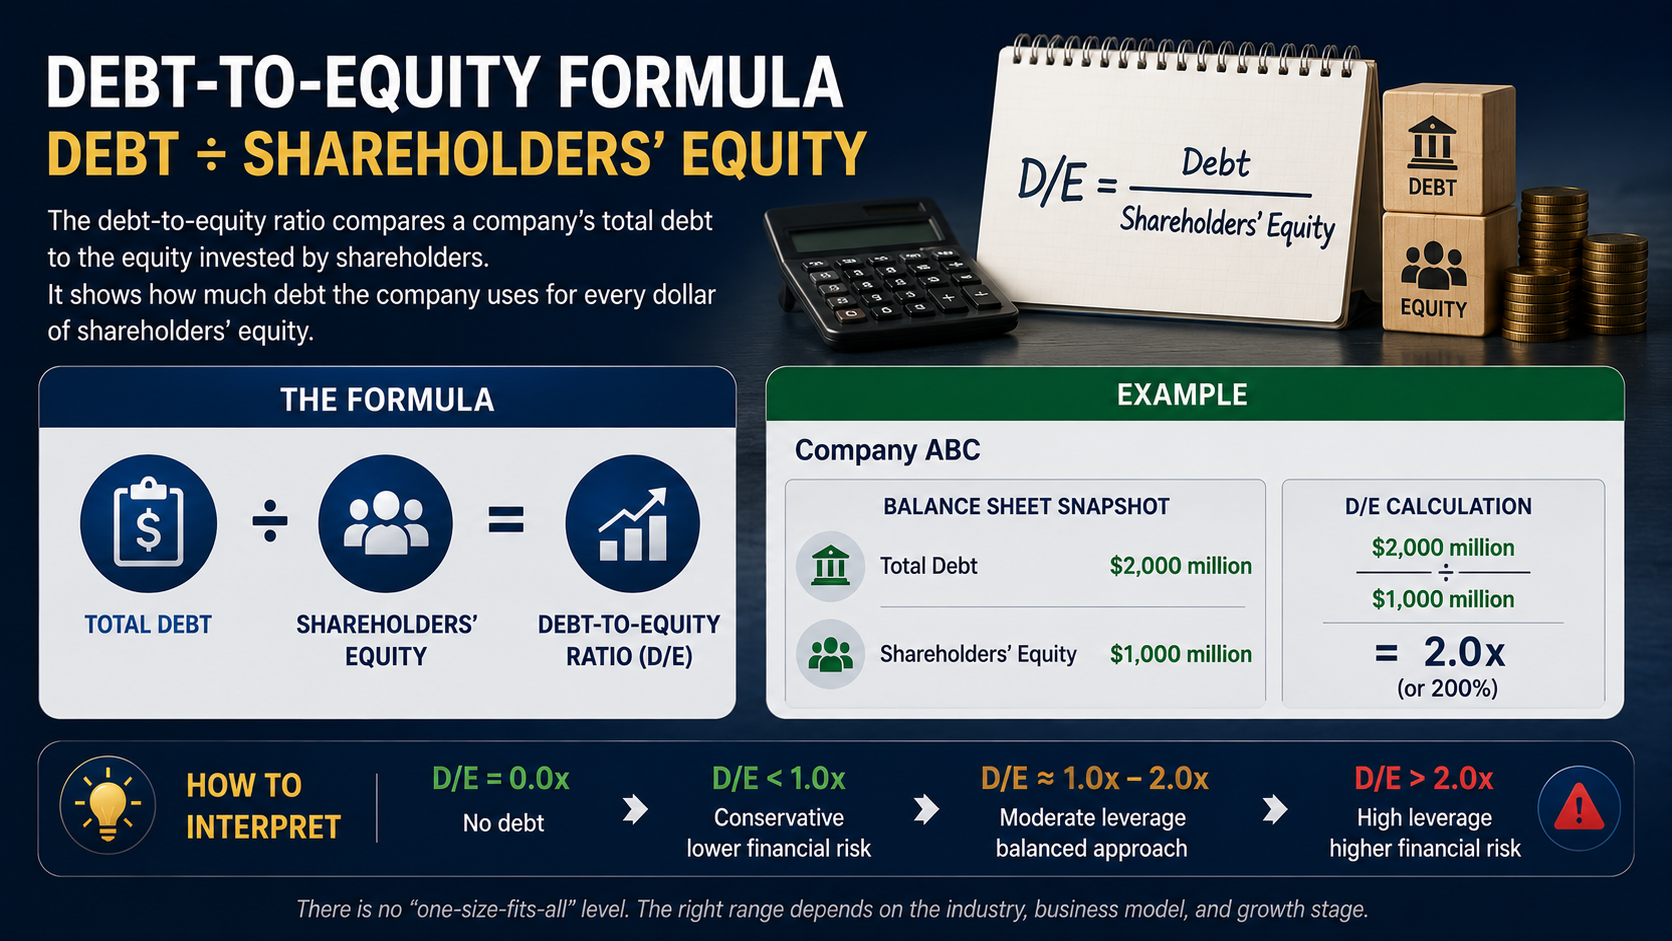
The debt-to-equity ratio is a leverage metric used to evaluate how heavily a company relies on borrowed capital relative to shareholders’ equity.
A simplified version is
Debt-to-Equity Ratio = Debt ÷ Shareholders’ Equity
Depending on the financial data provider and analytical purpose, investors may encounter versions based on total liabilities, total debt, or interest-bearing debt.
This distinction matters.
Suppose a company has
| Balance Sheet Item | Amount |
| Total Assets | $300 million |
| Liabilities | $200 million |
| Shareholders’ Equity | $100 million |
Using total liabilities relative to equity, the ratio would be
$200 million ÷ $100 million = 2.0x
In percentage terms, that would be 200%.
In simple language, the company has $2 of liabilities for every $1 of shareholders’ equity.
But investors should not stop there.
The real question is not simply
“How much debt does this company have?”
It is
“How difficult is that debt for this particular business to support?”
Debt Ratio vs. Debt-to-Equity Ratio: An Important Distinction
American investors may encounter several similarly named leverage ratios, so terminology matters.
A debt ratio commonly compares debt with assets
Debt Ratio = Debt ÷ Total Assets
A debt-to-equity ratio compares debt with shareholders’ equity
Debt-to-Equity = Debt ÷ Shareholders’ Equity
Some financial databases also calculate leverage using total liabilities instead of strictly interest-bearing debt.
Because definitions can differ across financial websites and data providers, investors should always check the methodology before comparing companies.
Two websites can display different D/E ratios for the same company without either number necessarily being incorrect.
They may simply be using different definitions of debt.
How Financial Leverage Works
Businesses need capital to grow.
A semiconductor manufacturer may need billions of dollars to build a fabrication plant. A utility may need significant capital to construct power infrastructure. An airline may finance aircraft, while a telecom company may borrow heavily to build and maintain its network.
Companies generally obtain capital from two broad sources
- Equity capital provided by shareholders.
- Debt capital obtained through loans, bonds, and other financing.
Using debt allows a company to control more assets without issuing additional shares.
This creates financial leverage.
And leverage can be extremely powerful.
It can also become extremely dangerous.
The Double-Edged Sword of Leverage
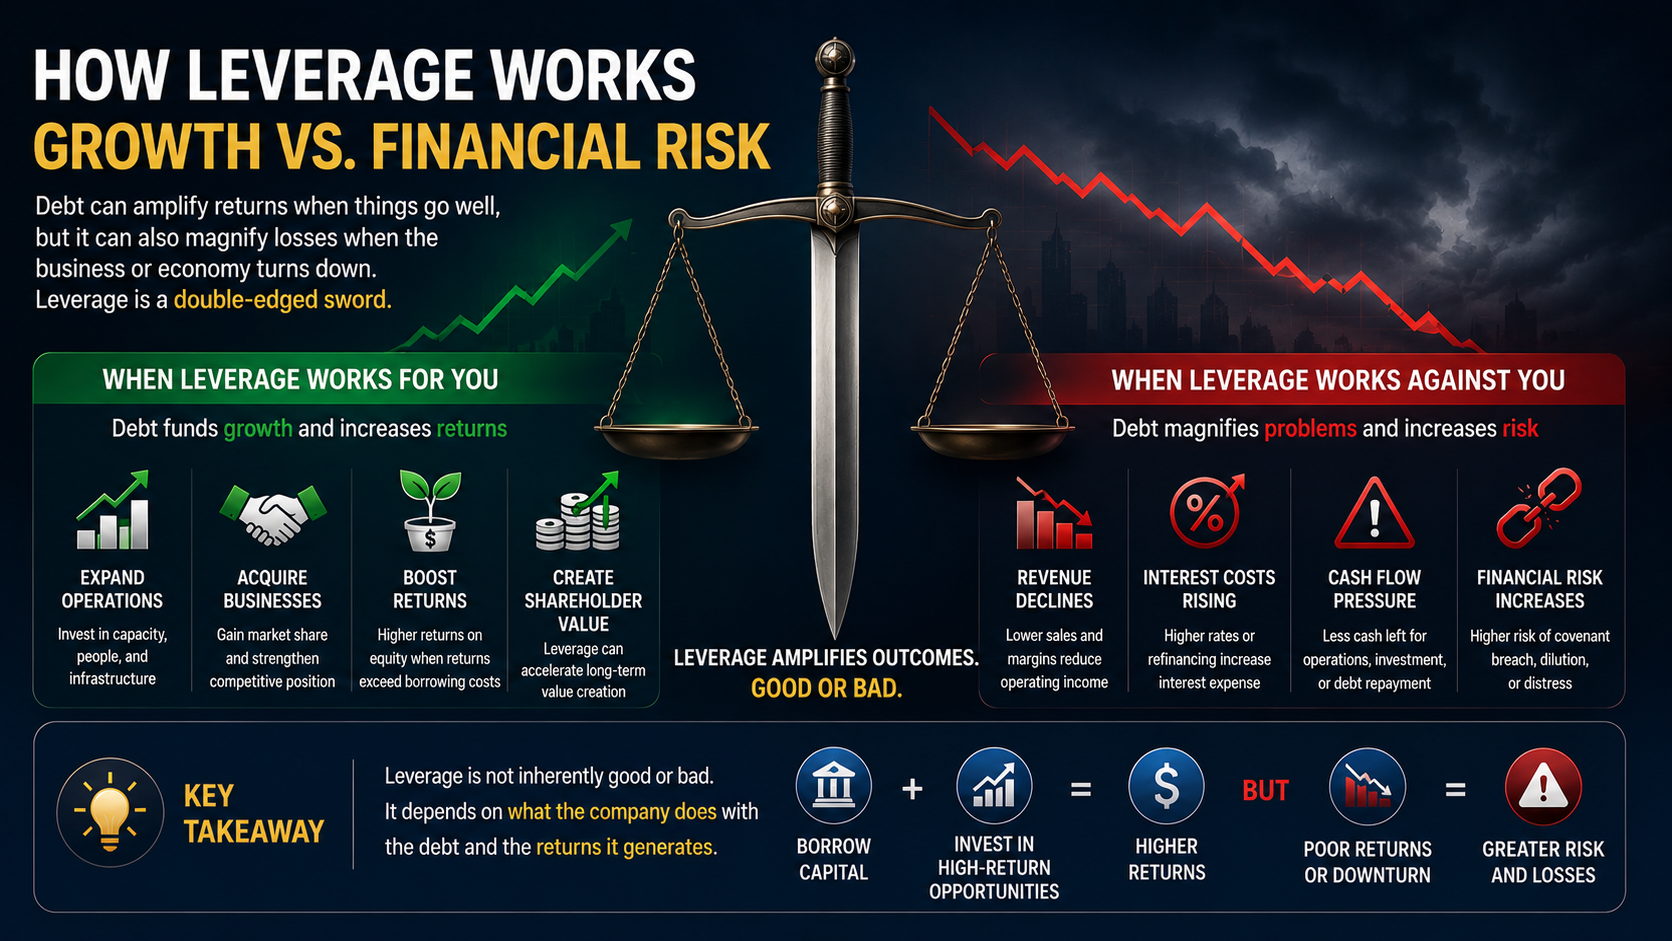
Debt itself is not inherently bad.
The economic outcome depends on what management does with the borrowed capital and whether the business generates returns that justify the financing cost.
When Debt Accelerates Growth
Imagine a company can borrow money at 5% and invest that capital into projects capable of producing sustainable returns significantly above its borrowing cost.
If those investments perform as expected, debt can increase earnings and potentially improve returns on shareholders’ capital.
Management may use debt to
- Build new production capacity
- Acquire competitors
- Expand distribution
- Invest in infrastructure
- Repurchase shares
- Finance working capital
Under favorable economic conditions, leverage can accelerate growth.
When Debt Becomes a Problem
Now reverse the situation.
Demand falls.
Revenue declines.
Margins compress.
Interest rates remain elevated.
The investment funded with debt produces lower returns than expected.
The company still owes interest.
And eventually, the principal must be repaid or refinanced.
This is the fundamental asymmetry of debt
Revenue can disappear. Debt obligations do not disappear with it.
That is why leverage often looks safest near the top of an economic cycle and becomes most dangerous after conditions deteriorate.
Why the Debt-to-Equity Ratio Matters
Many investors naturally focus on income statement metrics.
Revenue growth, EPS growth, gross margins, and operating margins are easy to understand and closely followed by Wall Street.
But long-term investors also need to understand the balance sheet.
The key question is
Can this company survive a period when the economy does not cooperate?
A Company Can Survive Losses but Still Fail From a Lack of Liquidity
A business does not automatically go bankrupt because it reports a net loss.
If it has sufficient cash reserves and access to capital, it may survive years of weak profitability.
A liquidity crisis is different.
If obligations become due and the company cannot produce the necessary cash or obtain refinancing, even a business with valuable technology or long-term growth potential can face severe financial stress.
This distinction is fundamental
Profitability tells investors how well a business is performing. Liquidity and balance-sheet strength help tell them how long it can keep playing the game.
Why Higher Interest Rates Make Debt More Important
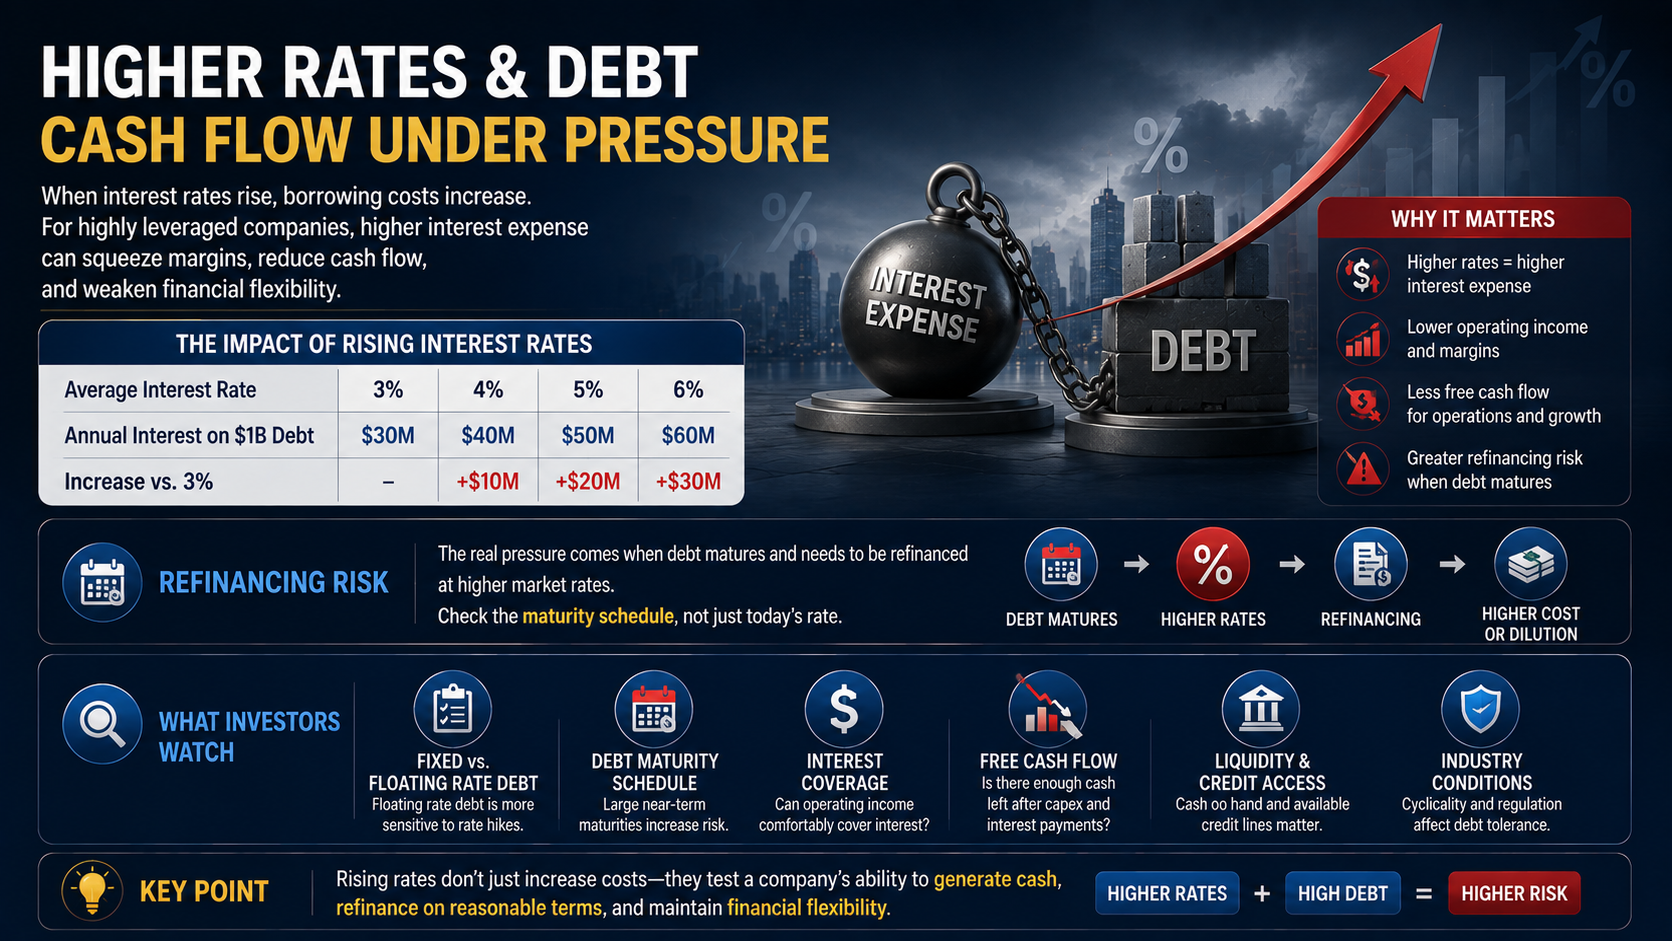
Leverage becomes especially important when interest rates rise.
Consider a company with $1 billion of debt.
At an average interest cost of 3%, annual interest expense would be approximately $30 million.
At 6%, that becomes approximately $60 million.
If operating income does not increase, that additional interest expense reduces earnings and cash available for shareholders, reinvestment, acquisitions, or debt repayment.
Not every company feels higher rates immediately.
Businesses with long-term fixed-rate debt may be insulated for years.
The real pressure can emerge when that debt matures and must be refinanced at higher market rates.
That is why sophisticated investors look beyond the current interest expense.
They ask
When does the debt mature?
A High Debt-to-Equity Ratio Is Not Automatically Bad
One of the biggest mistakes investors make is treating leverage ratios as universal safety scores.
There is no single D/E ratio that defines a healthy company across every industry.
Capital structures differ enormously.
Capital-Intensive Businesses
Utilities, telecom companies, infrastructure operators, airlines, and other capital-intensive businesses often operate with significant debt.
Their business models require large upfront investments.
In some cases, relatively predictable long-term cash flows can also support greater leverage.
Asset-Light Businesses
Software and many service businesses can often grow without enormous investments in physical assets.
As a result, some may operate with much less debt.
But a low D/E ratio does not automatically make an asset-light company safe.
A company burning hundreds of millions of dollars in cash every year can eventually face financing pressure even if its current debt load appears modest.
This is why investors should compare leverage
Across similar companies and across time.
Comparing a regulated utility directly with a software company tells investors very little.
Comparing two utilities with similar business models can be much more informative.
Why the Trend Matters More Than a Single Number
Suppose a company’s leverage rises sharply.
The obvious conclusion might be that it borrowed heavily.
But that is not always what happened.
Consider this example
| Shareholders’ Equity | Liabilities | Liabilities-to-Equity |
| $1.0 billion | $500 million | 0.5x |
| $500 million | $500 million | 1.0x |
| $250 million | $500 million | 2.0x |
Liabilities never increased.
But the leverage ratio quadrupled because shareholders’ equity collapsed.
This can happen after accumulated losses, asset write-downs, or other changes that reduce book equity.
Therefore, when leverage suddenly increases, investors should determine whether
- Debt increased
- Equity decreased
- Or both happened simultaneously
The ratio identifies the symptom.
The financial statements explain the cause.
Not All Debt Is Created Equal
Another common mistake is treating every liability as equally dangerous.
It is not.
Interest-Bearing Debt
Bank loans, bonds, and other borrowings generally require interest payments.
These obligations are particularly important because rising interest rates can directly increase financing pressure, especially when debt is floating-rate or must soon be refinanced.
Operating Liabilities
Accounts payable, deferred revenue, and other liabilities can arise naturally from business operations.
Consider a company that receives customer payments before delivering its service.
The accounting system may recognize a liability, but economically this can be very different from borrowing money from a bank.
Likewise, a powerful retailer may receive inventory from suppliers and pay them later, effectively obtaining short-term financing through its operating model.
This is why experienced investors do not ask only
“How large are total liabilities?”
They also ask
“What are those liabilities made of?”
Debt Maturity Can Matter as Much as Debt Size
Imagine two companies each carry $5 billion of debt.
Company A has maturities spread over the next decade.
Company B has $3 billion coming due within 18 months.
If credit markets suddenly tighten, Company B may face a much more serious problem.
It may have to refinance at a significantly higher interest rate, issue equity, sell assets, or reduce investment.
This is called refinancing risk.
Investors analyzing leveraged businesses should therefore examine
- Short-term borrowings
- Current portion of long-term debt
- Major bond maturities
- Fixed-rate versus floating-rate debt
- Available cash
- Credit facilities
- Free cash flow
A company can have manageable total debt but a dangerous maturity schedule.
Why Net Debt Matters
Gross debt tells only part of the story.
Suppose two companies each have $10 billion in debt.
Company A has $1 billion in cash.
Company B has $8 billion in cash.
Those balance sheets are clearly not equivalent.
This is where net debt becomes useful.
Net Debt = Interest-Bearing Debt − Cash and Cash Equivalents
Net debt provides a better picture of the company’s effective debt burden after considering readily available liquidity.
Some cash-rich companies can even have net cash, meaning their cash holdings exceed their financial debt.
For long-term investors, this distinction can be far more informative than gross debt alone.
Use Interest Coverage With the Debt-to-Equity Ratio
Debt size is only one side of the equation.
Investors also need to know whether the company generates enough earnings to service that debt.
One commonly used metric is the interest coverage ratio
Interest Coverage Ratio = Operating Income ÷ Interest Expense
Suppose Company A generates $1 billion in operating income and pays $100 million in annual interest.
Its interest coverage would be approximately 10x.
Company B might have a similar debt-to-equity ratio but generate only $150 million in operating income against $100 million in interest expense.
Its financial position is clearly more fragile.
The lesson is simple
The same amount of leverage can represent very different levels of risk depending on the company’s earning power.
Free Cash Flow Is Where Debt Ultimately Meets Reality
Accounting earnings matter, but debt is ultimately paid with cash.
That makes cash-flow analysis essential.
Investors should examine whether a business consistently generates
- Positive operating cash flow
- Sustainable free cash flow
- Enough cash to cover interest
- Enough cash to reduce debt over time
A company that produces strong free cash flow can often carry a larger debt load safely.
A company that continually burns cash may need repeated access to capital markets.
That creates a critical distinction.
One company uses the capital markets because it chooses to optimize its capital structure.
Another uses them because it must raise money to survive.
Those situations should never be valued the same way.
How Corporate Leverage Can Affect Financial Markets
A single company’s debt-to-equity ratio does not determine the direction of the S&P 500, Treasury yields, the U.S. dollar, gold, or Bitcoin.
But leverage becomes much more important when financial conditions tighten across the economy.
| Asset / Market | Potential Impact of Tight Credit Conditions |
| U.S. Stocks | Highly leveraged and weak-cash-flow businesses may face greater valuation and refinancing pressure |
| Corporate Bonds | Credit spreads can widen as investors demand more compensation for default risk |
| U.S. Treasuries | Severe risk-off periods can increase demand for high-quality government debt, though inflation and rate expectations also matter |
| U.S. Dollar / Cash | Liquidity stress can increase demand for dollars and short-term liquidity |
| Gold | Can respond to financial stress, real yields, monetary policy expectations, and currency conditions |
| Bitcoin | Can behave like a liquidity-sensitive risk asset during initial stress even if its longer-term investment narrative differs |
The key point is not that leverage mechanically determines asset prices.
The important relationship is between debt, liquidity, interest rates, and risk appetite.
When money is cheap, investors may tolerate weak balance sheets.
When money becomes expensive, the market starts asking harder questions.
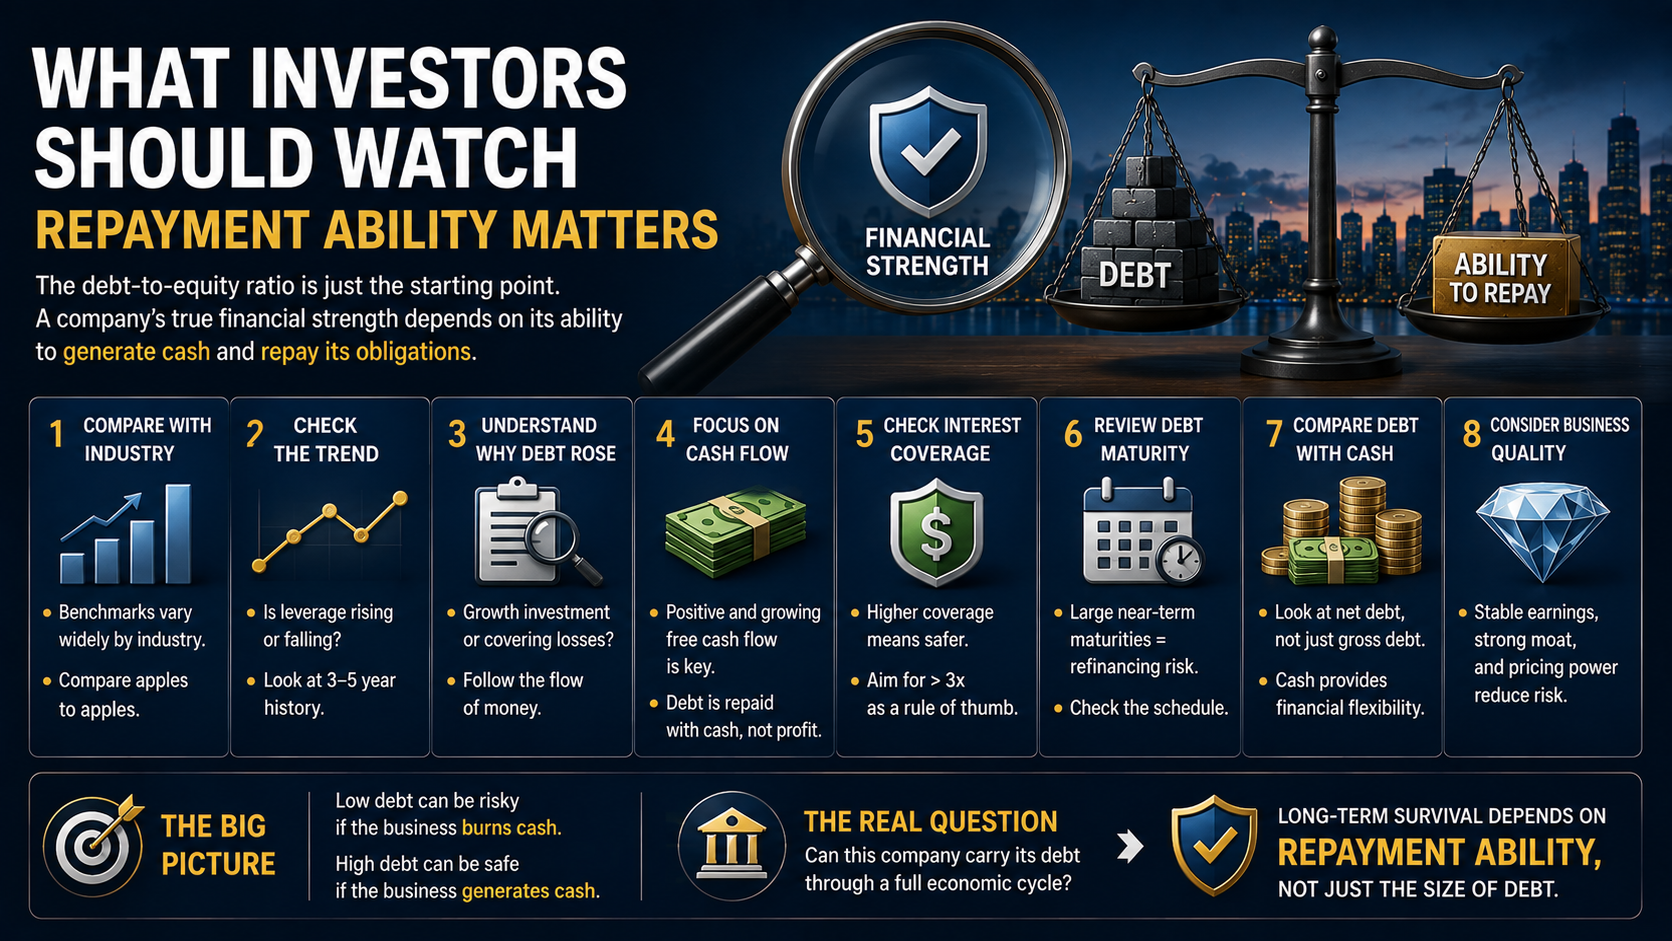
What Investors Should Check When Analyzing Debt
1. Compare the Company With Its Industry
Do not compare leverage across unrelated industries.
Compare companies with similar economics, capital requirements, and cash-flow profiles.
2. Look at the Multi-Year Trend
A five-year history can reveal far more than one quarterly snapshot.
Is leverage steadily declining?
Or is the company becoming increasingly dependent on borrowed capital?
3. Understand Why Debt Increased
Debt used to fund a high-return expansion is different from debt used to cover recurring operating losses.
Always ask where the borrowed money went.
4. Separate Financial Debt From Operating Liabilities
Interest-bearing debt deserves special attention because it directly creates financing costs and refinancing exposure.
5. Analyze Free Cash Flow
Debt is repaid with cash.
Consistent free cash flow can make a leveraged company significantly more resilient.
6. Check Interest Coverage
Ask how many times operating earnings cover annual interest expense and how that coverage might change during a downturn.
7. Examine the Maturity Schedule
Large near-term maturities can transform a manageable balance sheet into a refinancing problem.
8. Compare Debt With Cash
Gross debt without cash balances can provide a distorted picture.
Net debt often gives investors a clearer view of the effective financial burden.
Financial Metrics to Use Alongside Debt-to-Equity
No single financial ratio can measure corporate survival risk.
A stronger framework combines several metrics.
| Metric | What It Helps Measure |
| Debt-to-Equity | Financial leverage relative to shareholders’ equity |
| Net Debt | Effective financial debt after available cash |
| Interest Coverage | Ability of operating earnings to cover interest |
| Operating Cash Flow | Cash generated by the core business |
| Free Cash Flow | Cash remaining after necessary capital expenditures |
| Current Ratio | Short-term liquidity |
| ROE | Return generated on shareholders’ equity |
| ROIC | Efficiency of the company’s invested capital |
Taken together, these metrics help answer a much more useful question than simply whether debt is “high” or “low.”
They help answer
Can this company carry its capital structure through an entire economic cycle?
What Do Wealthy and Long-Term Investors Look For?
Long-term capital does not stop at asking
“What is the company’s debt-to-equity ratio?”
The more important question is
“Can this company continue generating cash through the next downturn?”
Follow the Flow of Money
When interest rates are low and liquidity is abundant, capital tends to become more tolerant of leverage.
Investors focus heavily on revenue growth, market share, and future earnings.
When rates rise and credit becomes scarce, the market's priorities often change.
Capital begins to favor companies with stronger cash flows, manageable refinancing requirements, and resilient balance sheets.
The more expensive money becomes, the more investors care about whether growth can finance itself.
Focus on Cash Flow
Every debt eventually encounters the same reality
It must either be repaid or refinanced.
That is why cash flow can become more important than the headline earnings number during periods of financial stress.
Long-term investors want to know whether a company is reducing debt with internally generated cash or issuing new debt simply to repay old obligations.
Measure Financial Survival
A strong balance sheet creates something investors often underestimate
Optionality.
A cash-rich company with manageable debt can continue investing during a recession.
It can maintain R&D.
It can acquire distressed competitors.
It can buy assets when prices are depressed.
It can potentially gain market share while weaker competitors retreat.
Balance-sheet strength is therefore not merely defensive.
It can become an offensive advantage during a crisis.
Think Through the Entire Economic Cycle
Before evaluating a leveraged company, investors can ask
- Is the debt funding productive growth or recurring losses?
- How much of the liability structure actually carries interest?
- Can free cash flow comfortably cover interest and principal obligations?
- Are major debt maturities concentrated in the next one to three years?
- What happens if refinancing rates remain elevated?
- Could the company survive a recession without issuing new equity?
- Does it have enough liquidity to invest while competitors are forced to retreat?
These questions move the analysis beyond a simple ratio.
They reveal the company's financial architecture.
Final Thoughts
The debt-to-equity ratio is one of the most useful starting points for understanding corporate leverage and financial risk.
But it should never be interpreted in isolation.
A high ratio does not automatically mean a company is dangerous, and a low ratio does not automatically mean it is safe.
Investors need to understand why the debt exists, what type of debt it is, how much interest it costs, when it matures, and whether the underlying business generates enough cash to support it.
Revenue and earnings tell us how fast a company may be growing.
The balance sheet and cash-flow statement tell us something equally important
How long can the company survive when conditions turn against it?
That distinction becomes especially important during recessions, credit contractions, and periods of elevated interest rates.
The core principle to remember is simple
The size of a company’s debt matters, but its ability to carry and repay that debt matters more. A strong balance sheet reveals its true value not when markets are easy, but when capital becomes scarce.
Investing is not only about predicting the next expansion.
It is also about identifying businesses capable of surviving the downturns no one can predict.
This was MasterMind.
'[Global] Success Blueprints' 카테고리의 다른 글