What Is the Advance/Decline Line? How Investors Measure Market Breadth


Hello, this is MasterMind.
Have you ever watched the S&P 500 or Nasdaq climb to a new high while most of the stocks in your portfolio remained flat or continued to fall?
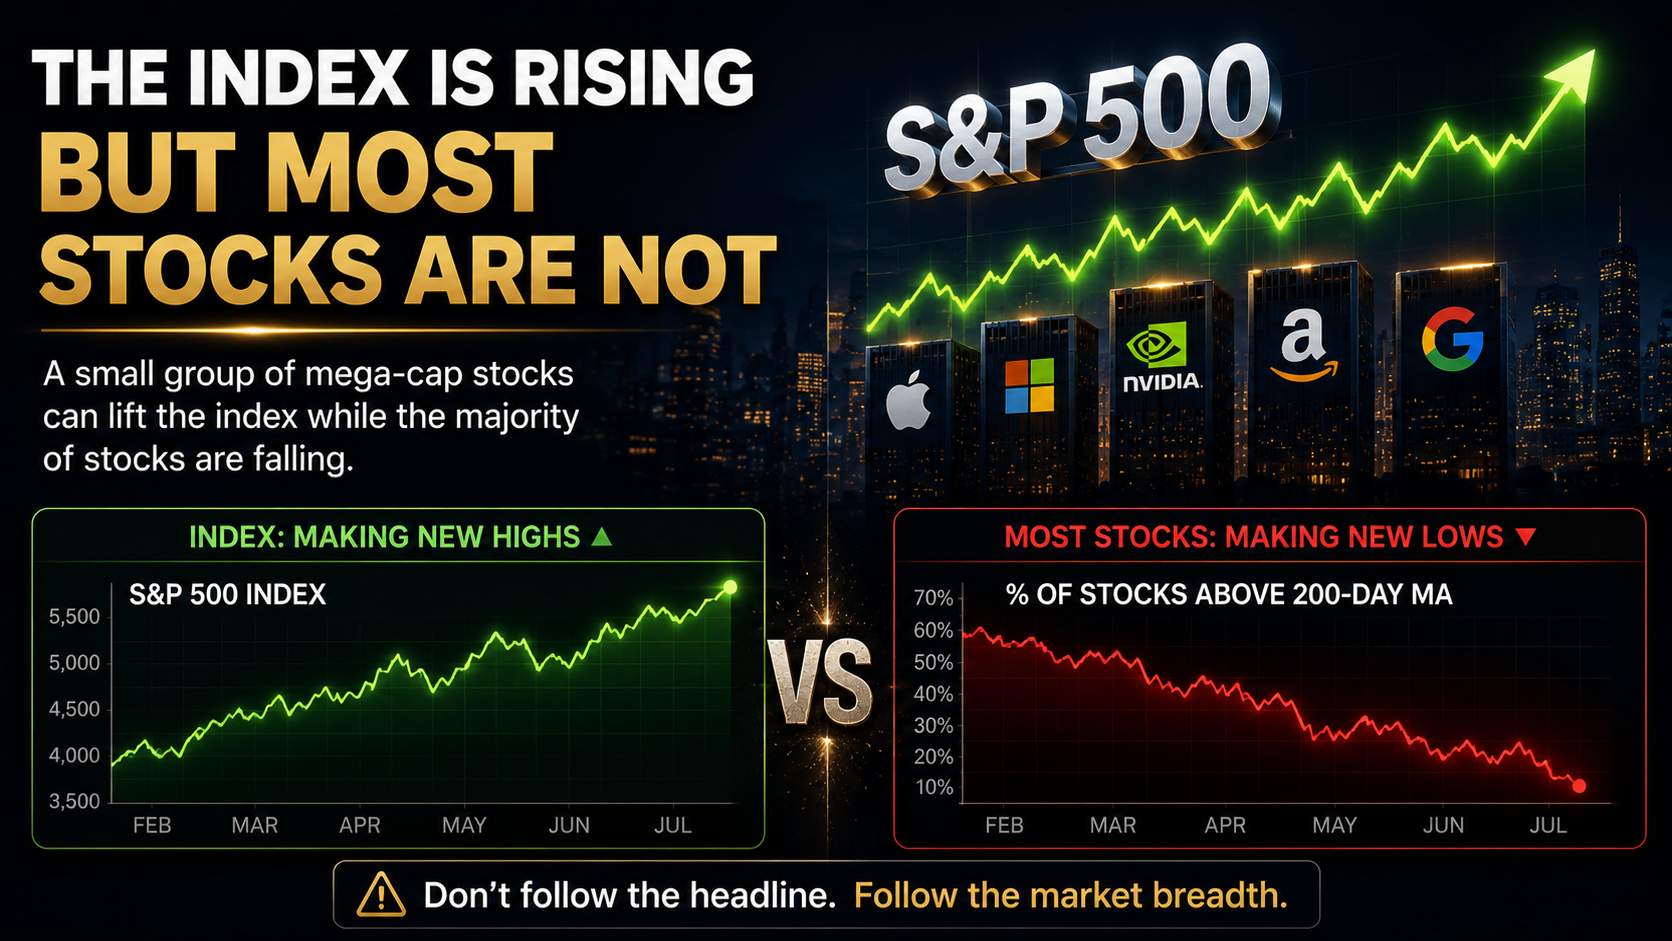
When a major index rises, it is easy to assume that the entire stock market is healthy. But that is not always the case. A small group of mega-cap companies can sometimes push an index higher even while a large percentage of individual stocks are weakening beneath the surface.
So how can investors tell whether a market rally is broad and sustainable or dependent on only a handful of dominant companies?
One of the most useful tools for answering that question is the Advance/Decline Line, commonly known as the A/D Line.
The A/D Line is a market breadth indicator that measures how many stocks are participating in a market move. Instead of focusing only on the performance of the largest companies, it helps investors examine the condition of the market as a whole.

Key Takeaway
The Advance/Decline Line measures the market’s underlying strength by tracking whether more stocks are rising or falling, helping investors determine whether an index rally is broadly supported or driven by only a small number of large companies.
What Is the Advance/Decline Line?
The Advance/Decline Line, or A/D Line, is a cumulative market breadth indicator based on the number of stocks that rise and fall during each trading session.
It is calculated by subtracting the number of declining stocks from the number of advancing stocks and then adding the result to the previous day’s A/D Line value.
In simple terms, the indicator answers one important question
Are more stocks participating in the market’s upward movement, or are more stocks falling behind?
This matters because widely followed indexes such as the S&P 500 and Nasdaq Composite do not always represent every stock equally.
The S&P 500, for example, is weighted by market capitalization. Larger companies have a greater influence on the index than smaller companies. As a result, a strong move in several mega-cap stocks can lift the entire index even when hundreds of other companies are declining.
The A/D Line approaches the market differently.
Each stock receives one equal vote.
- A trillion-dollar company counts as one advancing or declining stock.
- A mid-cap company also counts as one.
- A smaller company receives the same treatment.
Because of this equal-weighted approach, the A/D Line can reveal whether strength is spreading across the market or remaining concentrated in a narrow group of leaders.
How Is the Advance/Decline Line Calculated?

The basic formula is straightforward
Today’s A/D Line = Previous A/D Line + Advancing Stocks − Declining Stocks
The calculation uses two daily figures
- Advancing stocks: The number of stocks that close higher than the previous session
- Declining stocks: The number of stocks that close lower than the previous session
Stocks that finish unchanged are generally excluded from the calculation.
A Simple Example
Suppose 3,000 stocks trade on a particular exchange during the day.
- 1,900 stocks close higher
- 1,000 stocks close lower
- 100 stocks finish unchanged
The daily advance-decline value would be
1,900 − 1,000 = +900
That positive number is added to the previous day’s A/D Line value.
Now assume that on the following day
- 1,200 stocks advance
- 1,700 stocks decline
The daily value becomes
1,200 − 1,700 = −500
That amount is subtracted from the cumulative total.
The absolute number of the A/D Line is not usually the most important part of the analysis. Investors focus primarily on
- The direction of the line
- Its trend over time
- Whether it confirms or contradicts the movement of the broader index
Why Can Stock Indexes Create a Misleading Picture?
Major stock indexes are useful, but they do not always provide a complete view of market conditions.
Imagine that the S&P 500 rises 1.5% in one day. At first glance, this appears to be a strong session.
But suppose most of that gain comes from a small number of companies such as Apple, Microsoft, Nvidia, Amazon, and Alphabet, while most other stocks decline.
The index may be rising, but the market beneath the surface may be weakening.
This is known as narrow market leadership.
Now consider the opposite situation.
The S&P 500 is nearly unchanged, but hundreds of industrial, financial, healthcare, consumer, and small-cap stocks are moving higher.
In that case, the headline index may look unremarkable, while the internal structure of the market is actually improving.
This is why investors often examine market breadth alongside price indexes.
An index shows the final result, but market breadth shows how many stocks helped create that result.
Why Market Breadth Matters
Market breadth refers to the number or proportion of stocks participating in a market trend.
A rally supported by a large number of stocks is generally considered broader and healthier than a rally driven by only a few large companies.
When market breadth is strong
- Capital is spreading across multiple sectors.
- Investor confidence is not limited to a few popular names.
- Mid-cap and small-cap stocks may begin participating.
- The rally may have a more stable foundation.
- Economic expectations may be improving across a wider group of businesses.
When market breadth is weak
- Money may be concentrating in a small number of defensive or dominant companies.
- Investors may be avoiding economically sensitive sectors.
- Smaller companies may be struggling with financing conditions or slowing demand.
- The index may appear stronger than the average stock.
- The market may become more vulnerable if the leading companies lose momentum.
A strong market does not require every stock to rise. However, sustained bull markets usually benefit from broader participation over time.
The true strength of a market is not measured only by how high the index rises, but by how widely capital is willing to participate.
How to Interpret a Rising A/D Line
When the A/D Line is trending upward, more stocks are advancing than declining over time.
This often suggests that buying pressure is broadening across the market.
Broad Participation
An upward A/D Line can indicate that investors are purchasing stocks across multiple industries rather than concentrating only in a few mega-cap leaders.
This may include
- Technology
- Financials
- Industrials
- Consumer discretionary companies
- Healthcare
- Energy
- Small-cap and mid-cap stocks
Broad participation can strengthen confidence in the overall market trend.
Improving Risk Appetite
A rising A/D Line may also suggest that investors are becoming more comfortable taking risk.
When capital moves beyond the largest and most financially secure companies, it can indicate improving confidence in economic growth, corporate earnings, or financial conditions.
Confirmation of an Index Rally
If both the stock index and the A/D Line are making new highs, the rally is being confirmed by a wide range of stocks.
This does not guarantee that the market will continue rising, but it suggests that the upward trend has stronger internal support.
How to Interpret a Falling A/D Line
A declining A/D Line means that more stocks are falling than rising over time.
This can happen even when a major index remains near a record high.
Narrowing Leadership
When the index rises but the A/D Line weakens, fewer stocks are carrying the market.
Investors may be concentrating capital in a small group of companies that are viewed as safer, more profitable, or more likely to benefit from a major investment theme.
This can make the market more dependent on the continued performance of those leaders.
Weakness Beneath the Surface
A falling A/D Line may reveal deterioration in
- Small-cap stocks
- Cyclical sectors
- Regional banks
- Unprofitable growth companies
- Highly leveraged businesses
- Economically sensitive industries
The index may hide this weakness if its largest components remain strong.
Rising Market Fragility
A narrow rally can continue for a long time. Weak breadth is not an automatic signal that the market is about to crash.
However, concentration increases vulnerability.
If the few stocks supporting the index begin to decline, there may be fewer healthy sectors available to absorb the selling pressure.
Understanding Divergence Between the A/D Line and the Market
The most important use of the Advance/Decline Line is often the identification of divergence.
Divergence occurs when the stock index and the A/D Line move in different directions.
This suggests that the headline market trend and the behavior of the average stock are no longer telling the same story.

Bearish Divergence
A bearish divergence occurs when
- A major stock index reaches a new high
- The A/D Line fails to reach a new high or begins declining
This means that the index is still rising, but fewer stocks are participating in the advance.
In practical terms, market leadership is narrowing.
A bearish divergence can suggest
- Investor enthusiasm is becoming concentrated.
- Smaller companies are losing momentum.
- Some sectors may already be entering corrections.
- The rally is becoming more dependent on mega-cap stocks.
- Internal market strength is deteriorating.
Bearish divergence is often treated as a warning signal rather than a precise timing tool.
A market can continue rising even after breadth begins weakening. Therefore, investors should not assume that divergence guarantees an immediate decline.
Its value lies in showing that the quality of the rally may be changing.
Bullish Divergence
A bullish divergence occurs when
- The stock index remains weak or makes a lower low
- The A/D Line stabilizes or begins rising
This indicates that fewer stocks are participating in the decline.
Even though the index remains under pressure, more individual stocks may be starting to recover.
A bullish divergence can suggest
- Selling pressure is becoming less widespread.
- Some sectors have already formed a bottom.
- Capital is quietly returning to previously weak areas.
- The average stock may be improving before the major index reflects it.
- Market internals may be strengthening.
As with bearish divergence, bullish divergence is not a guaranteed buy signal.
It is better understood as evidence that internal conditions may be improving before the broader index changes direction.
Why Institutional Investors Watch the A/D Line
Institutional investors do not rely only on headline index movements.
They often analyze market internals to determine whether price trends are supported by broad capital participation.
A major index can be influenced by a relatively small group of large companies. But it is much harder for the entire market to create the same illusion.
The A/D Line helps institutional investors evaluate
- The quality of a rally
- The breadth of risk appetite
- Sector rotation
- Small-cap participation
- The durability of market momentum
- Whether capital is spreading or concentrating
For this reason, the A/D Line can be viewed as a type of market health check.
The index may show the market’s appearance. The A/D Line can reveal what is happening underneath.
What the A/D Line Can Tell Investors About Money Flow
One of the most valuable uses of market breadth is understanding where money is moving.
Capital Spreading Across the Market
When the A/D Line rises along with the index, capital may be moving from a narrow group of leaders into a broader range of companies.
This often appears during sector rotation.
For example, money may shift from large technology stocks into
- Financials
- Industrials
- Energy
- Healthcare
- Consumer stocks
- Small-cap companies
This does not necessarily mean the original market leaders are weakening. It may simply mean that investors are finding opportunities elsewhere.
Capital Concentrating in Mega-Cap Stocks
If the index rises while the A/D Line falls, money may be leaving weaker sectors and moving toward a small group of dominant companies.
This often happens when investors become more selective.
They may prefer companies with
- Strong free cash flow
- Large cash balances
- Stable profit margins
- Market-leading positions
- Lower refinancing risk
- Greater pricing power
In this environment, the index can remain strong even while the average stock struggles.
Capital Moving Toward Safety
Weak breadth can also reflect a defensive shift.
Investors may be reducing exposure to cyclical or financially vulnerable companies while holding a narrow group of businesses viewed as resilient.
This is why weak breadth does not always mean speculative excess. Sometimes it reflects concern about the economy, interest rates, credit conditions, or corporate earnings.
How the A/D Line May Relate to Other Asset Classes
The A/D Line is primarily a stock market indicator. It does not directly predict bonds, the U.S. dollar, gold, or Bitcoin.
However, changes in market breadth can provide useful clues about broader risk appetite.
| Asset Class | Broad, Rising A/D Line | Weak or Falling A/D Line |
| U.S. stocks | Broad participation and healthier risk appetite | Narrow leadership and greater market fragility |
| Small-cap stocks | More likely to participate in a risk-on environment | May underperform as investors prefer stronger balance sheets |
| Treasury bonds | Yields may face upward pressure if growth expectations improve | Demand may increase if investors seek safety |
| U.S. dollar | May weaken during broad global risk appetite | May strengthen during risk aversion or liquidity stress |
| Gold | Safe-haven demand may soften | Demand may rise if financial risk increases |
| Bitcoin | May benefit from abundant liquidity and stronger risk appetite | Can experience greater volatility during risk-off periods |
These relationships are not fixed.
Interest rates, inflation, Federal Reserve policy, earnings expectations, credit conditions, and geopolitical events can all outweigh market breadth signals.
The A/D Line should therefore be used as part of a broader framework, not as a standalone forecasting tool.
Key Points Investors Should Check
1. Is the A/D Line Confirming the Index?
The first question is whether the A/D Line and the major index are moving in the same direction.
When both make new highs, the market trend is broadly confirmed.
When they diverge, the quality of the trend may be changing.
2. Is Market Participation Expanding?
Look beyond the largest companies.
Are mid-cap and small-cap stocks participating? Are more sectors rising? Are equal-weighted indexes improving?
Expanding participation can be a sign that liquidity is spreading.
3. Is the Market Becoming More Concentrated?
A market led by a few exceptional companies can still produce strong returns.
However, the more concentrated the index becomes, the more dependent it is on those leaders maintaining their earnings growth and valuations.
Investors should understand that index strength and market strength are not always the same thing.
4. Is Sector Rotation Taking Place?
Sometimes the index moves sideways while the A/D Line rises.
This can happen when money rotates from previous leaders into sectors that had been left behind.
Instead of interpreting a flat index as a weak market, investors should examine whether internal participation is improving.
5. Is the Signal Persistent?
One weak breadth session is rarely meaningful.
Investors should focus on trends that persist over multiple weeks or months.
The A/D Line is most useful when analyzed as a cumulative trend rather than as a daily trading signal.
Other Market Breadth Indicators to Use With the A/D Line
The A/D Line should not be used in isolation.
Several other indicators can provide additional context.
McClellan Oscillator
The McClellan Oscillator also uses advancing and declining stocks but applies exponential moving averages to measure shorter-term breadth momentum.
It can help investors evaluate whether breadth is becoming overextended or reversing.
New Highs and New Lows
This indicator compares the number of stocks reaching new 52-week highs with the number reaching new 52-week lows.
A healthy rally is generally more convincing when new highs are expanding and new lows remain limited.
Advance/Decline Volume
Instead of counting only the number of stocks rising and falling, advance/decline volume compares the trading volume flowing into advancing and declining stocks.
This helps investors judge whether breadth is supported by meaningful capital movement.
Equal-Weighted Indexes
An equal-weighted version of the S&P 500 gives each component the same influence.
Comparing the equal-weighted index with the traditional market-cap-weighted index can reveal whether mega-cap stocks are dominating performance.
Percentage of Stocks Above Moving Averages
Investors can also track the percentage of stocks trading above their 50-day or 200-day moving averages.
This provides another view of how widely a trend is distributed across the market.
Using several breadth indicators together can reduce the risk of overreacting to one isolated signal.
Limitations of the Advance/Decline Line
The A/D Line is useful, but it is not perfect.
It Is Not a Market-Timing Tool
A divergence can persist for a long time.
The market may continue rising even while breadth weakens, particularly when a small group of highly profitable companies is producing exceptional earnings growth.
Different Exchanges Produce Different Signals
An A/D Line based on New York Stock Exchange data may behave differently from one based on Nasdaq-listed stocks or S&P 500 components.
Investors should know which universe of stocks the indicator is measuring.
It Does Not Measure Company Quality
Every stock receives one vote, regardless of financial strength.
A rising stock with strong cash flow counts the same as a speculative company with weak fundamentals.
The A/D Line measures participation, not business quality.
It Can Be Affected by Market Structure
The composition of an exchange can change over time.
The presence of preferred stocks, closed-end funds, foreign listings, and other securities may influence exchange-based breadth data.
Breadth Can Be Weak for Rational Reasons
If earnings growth is concentrated in a few industries, the market may reasonably assign higher valuations to those areas.
Narrow leadership is not always irrational. It simply means that the market is more dependent on a limited set of companies.
The correct response is not automatic pessimism. It is greater awareness of concentration risk.
What Do Wealthy and Long-Term Investors Look For?
Experienced investors do not focus only on whether the S&P 500 rose or fell during one session.
They ask deeper questions about the flow of capital and the durability of the businesses they own.
Money Flow
Is liquidity spreading across the market, or is capital retreating into a small group of mega-cap companies?
Broadening participation may indicate improving confidence. Narrowing participation may reflect caution, concentration, or a search for safety.
Cash Flow
Are rising stock prices supported by improving earnings and free cash flow across many companies?
Or is the market relying on only a few firms with exceptional profitability?
A broad market supported by healthy cash generation is structurally different from one driven mainly by valuation expansion.
Asset Resilience
If the market’s leading stocks suddenly lose momentum, can the portfolio survive?
The purpose of studying market breadth is not to predict the exact date of a correction. It is to understand how exposed a portfolio is to changes in leadership and liquidity.
Long-Term Perspective
Is the current market offering broad opportunities, or are returns becoming increasingly dependent on a few expensive companies?
Long-term investors do not need every position to rise at the same time. But they should understand whether the overall market environment is becoming stronger or more fragile.
Useful questions include
- How many stocks are participating in the current rally?
- Are small-cap and mid-cap stocks improving?
- Is capital rotating into additional sectors?
- Does the A/D Line confirm the index’s new high?
- Is my portfolio overly dependent on the same market leaders?
- Could I withstand a period in which those leaders underperform?
- Are my holdings supported by durable cash flow and strong balance sheets?
Investing is not only about predicting what happens next.
It is about building enough resilience to remain invested when the market does something unexpected.

Final Thoughts
The Advance/Decline Line is more than a simple count of rising and falling stocks.
It is a window into the internal condition of the stock market.
Major indexes show where the market ended. The A/D Line helps explain how the market got there.
When the index and the A/D Line rise together, the rally is supported by broad participation.
When the index rises while the A/D Line weakens, market leadership is narrowing and the rally may be becoming more fragile.
Neither signal guarantees the market’s next move. But both can help investors separate a broadly supported trend from one dependent on a small number of dominant companies.
The most important idea to remember is this
A truly strong market is not created by only a few mega-cap stocks. It is built when a wide range of companies participate in the advance.
The goal of market analysis is not to predict every short-term move correctly. It is to understand risk, follow the flow of capital, and remain financially resilient through changing market conditions.
This was MasterMind.
'[Global] Success Blueprints' 카테고리의 다른 글