What Is a Balance Sheet? Why Investors Use It to Measure a Company's Financial Strength


Hello, this is MasterMind.
When a company reports rising revenue and stronger earnings, investors often assume the business is healthy.
But is a profitable company always financially strong?
Not necessarily.
A company can post impressive earnings while carrying too much debt, holding too little cash, or struggling to collect money from customers. Another company may report slower growth but remain far more resilient because it has a strong cash position, manageable liabilities, and valuable assets.
To understand the difference, investors need to know how to read the balance sheet.
The balance sheet is more than an accounting document. It is a snapshot of a company’s financial structure, showing what the business owns, what it owes, and how much value ultimately belongs to shareholders.

One-Sentence Conclusion
A balance sheet shows a company’s assets, liabilities, and shareholders’ equity at a specific point in time, helping investors evaluate financial stability, liquidity, debt risk, and long-term survival potential.
What Is a Balance Sheet?
A balance sheet is one of the three primary financial statements used to analyze a company.
The other two are
- The income statement
- The cash flow statement
Each statement answers a different question.
The income statement shows how much revenue and profit a company generated over a period of time.
The cash flow statement shows how cash moved into and out of the business.
The balance sheet shows the company’s financial position at a specific moment.
That distinction is important.
If the income statement is a movie showing business performance over time, the balance sheet is a photograph taken on a particular date.
A quarterly balance sheet may show the company’s financial position as of March 31, while an annual balance sheet may show its condition as of December 31.
The basic accounting equation is
Assets = Liabilities + Shareholders’ Equity
This equation must always remain balanced.
It tells investors that everything a company owns was financed in one of two ways
- Through money borrowed from creditors
- Through capital provided or retained for shareholders

The Three Main Parts of a Balance Sheet
A balance sheet is divided into three major categories
- Assets
- Liabilities
- Shareholders’ equity
Understanding these three sections is the foundation of balance sheet analysis.
Assets: What the Company Owns
Assets are economic resources that the company owns or controls and expects to use to generate future value.
Common assets include
- Cash and cash equivalents
- Marketable securities
- Accounts receivable
- Inventory
- Property, plant, and equipment
- Long-term investments
- Patents and intellectual property
- Goodwill and other intangible assets
Assets are generally divided into current assets and noncurrent assets.
Current Assets
Current assets are expected to be converted into cash, sold, or used within one year.
Examples include
- Cash
- Short-term investments
- Accounts receivable
- Inventory
- Prepaid expenses
These assets matter because they help determine whether a company can meet its near-term financial obligations.
Noncurrent Assets
Noncurrent assets are expected to remain in the business for more than one year.
Examples include
- Factories
- Office buildings
- Equipment
- Long-term investments
- Patents
- Goodwill
These assets may support long-term growth, but they are usually less liquid than cash.
This leads to an important principle
The size of a company’s assets matters, but the quality and liquidity of those assets matter even more.
Two companies may each report $10 billion in total assets, yet their financial strength may be very different.
One company may hold large cash reserves and highly liquid securities.
The other may hold aging inventory, difficult-to-sell equipment, and intangible assets whose value could decline during a downturn.
The balance sheet helps investors distinguish between those situations.
Liabilities: What the Company Owes
Liabilities represent financial obligations that the company must repay or settle in the future.
Common liabilities include
- Accounts payable
- Short-term borrowings
- Long-term debt
- Corporate bonds
- Lease obligations
- Accrued expenses
- Deferred tax liabilities
- Pension obligations
Like assets, liabilities are divided into current and noncurrent categories.
Current Liabilities
Current liabilities are obligations due within one year.
Examples include
- Accounts payable
- Short-term loans
- Current portions of long-term debt
- Accrued expenses
- Taxes payable
These obligations are especially important because they create immediate cash demands.
Long-Term Liabilities
Long-term liabilities are due more than one year in the future.
Examples include
- Long-term bank debt
- Corporate bonds
- Long-term lease obligations
- Pension liabilities
Debt is not automatically bad.
Many successful U.S. companies use debt to finance acquisitions, invest in factories, repurchase shares, or expand into new markets.
The real question is not whether a company has debt.
The real question is
Can the company comfortably service that debt without weakening its operations or depending on constant refinancing?
A company with strong cash flow may safely carry more debt than a cyclical or unprofitable business.
That is why liabilities should never be judged in isolation.
They must be compared with cash, earnings, operating cash flow, and the stability of the underlying business.
Shareholders’ Equity: What Belongs to Investors
Shareholders’ equity is the residual value left after subtracting total liabilities from total assets.
The formula is
Shareholders’ Equity = Assets − Liabilities
In simple terms, equity represents the portion of the company that belongs to shareholders.
Common components include
- Common stock
- Additional paid-in capital
- Retained earnings
- Accumulated other comprehensive income
- Treasury stock
Retained Earnings
Retained earnings are especially important.
They represent the cumulative profits a company has kept inside the business rather than distributing through dividends or using them for other shareholder returns.
A steadily rising retained earnings balance may indicate that the company has consistently generated profits and reinvested part of them.
However, investors should not assume that rising retained earnings automatically create value.
The key question is whether management can reinvest that capital at attractive returns.
A company can retain billions of dollars and still destroy shareholder value if it spends poorly, overpays for acquisitions, or invests in low-return projects.
How a Balance Sheet Works
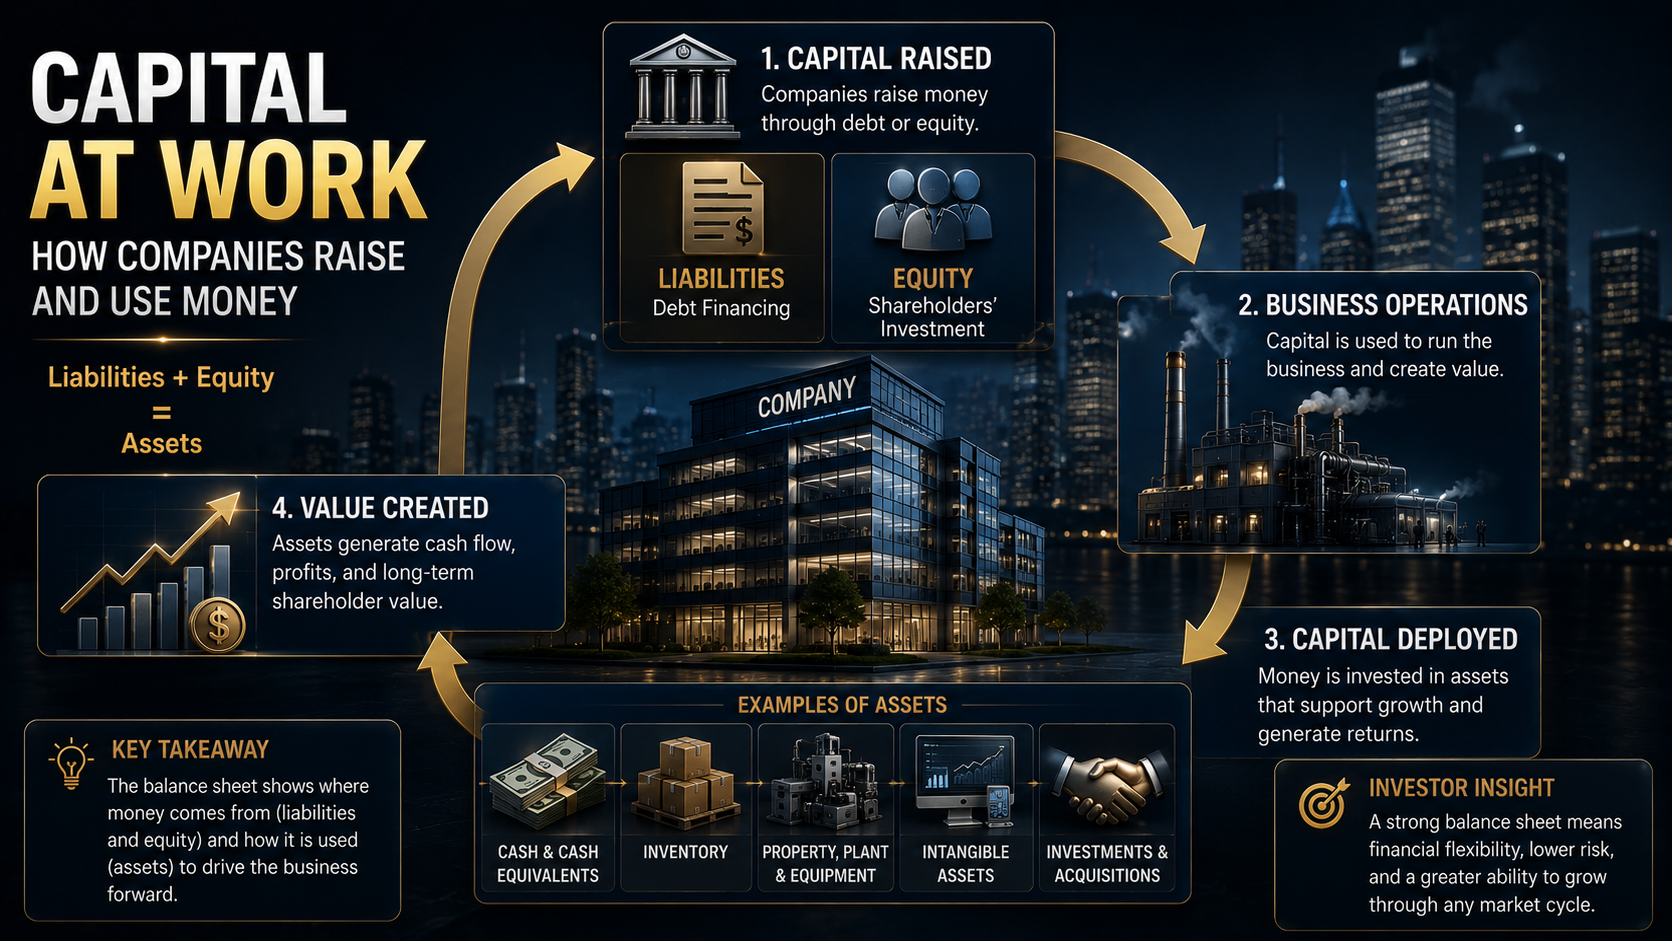
A balance sheet reveals both sides of corporate finance
- Where the money came from
- Where the money went
The liabilities and equity side shows how the company raised capital.
The asset side shows how that capital is being used.
A company can finance itself through
- Borrowing
- Issuing shares
- Retaining profits generated by the business
That capital may then be used to acquire
- Cash
- Inventory
- Equipment
- Real estate
- Technology
- Investments
- Other companies
Consider a simplified example.
Suppose a company has the following balance sheet
| Item | Amount |
| Cash and short-term investments | $300 million |
| Property and equipment | $700 million |
| Total assets | $1 billion |
| Total liabilities | $250 million |
| Shareholders’ equity | $750 million |
The accounting equation remains balanced
$1 billion in assets = $250 million in liabilities + $750 million in equity
This example tells investors how the company financed its assets and how much of the business is supported by creditor capital versus shareholder capital.
But investors should go further.
They should ask
- How much of the $300 million in cash is actually available?
- Does the company need most of that cash to fund daily operations?
- Is the equipment productive or becoming obsolete?
- When does the debt mature?
- Is the company generating enough free cash flow to repay it?
A balance sheet is not just about reading totals. It is about understanding the economic reality behind the numbers.
Why Is the Balance Sheet Important?

During strong bull markets, balance sheet risk is easy to ignore.
When capital is abundant, interest rates are low, and investors are willing to fund growth, financially weak companies may survive for years.
That changes when liquidity tightens.
Higher interest rates increase borrowing costs.
Falling asset prices weaken collateral values.
Banks become more selective.
Investors become less willing to finance unprofitable businesses.
At that point, the balance sheet can determine which companies survive and which companies are forced to cut investment, issue shares, sell assets, or restructure debt.
A company can report an accounting profit and still face financial distress.
This can happen when
- Customers have not yet paid their bills
- Inventory is building faster than sales
- Debt payments are approaching
- Interest expense is rising
- Cash is being consumed by capital spending
- Short-term obligations exceed available liquidity
This is why investors must distinguish between profit and solvency.
The income statement shows whether a company earned money. The balance sheet helps show whether it can survive long enough to keep earning it.
In financial markets, survival often matters more than short-term growth.
How the Balance Sheet Affects Stocks, Bonds, Gold, and Bitcoin
A company’s balance sheet primarily affects its own stock and debt securities, but balance sheet conditions across the economy can also influence broader asset markets.
| Asset Class | Potential Impact |
| Stocks | Companies with strong cash positions and manageable debt may be more resilient during recessions and periods of higher interest rates. Highly leveraged companies may face refinancing pressure, earnings dilution, or financial distress. |
| Corporate Bonds | Stronger balance sheets generally reduce credit risk. Weaker balance sheets may lead investors to demand higher yields, pushing bond prices lower. |
| U.S. Dollar | During periods of global stress, capital may move toward dollar-denominated cash and high-quality U.S. assets. Corporate balance sheet weakness can also influence credit conditions and economic expectations. |
| Gold | Rising financial instability or concerns about systemic risk may increase demand for gold as a defensive asset. |
| Bitcoin | Bitcoin often responds more strongly to liquidity and risk appetite than to individual corporate balance sheets. Easier financial conditions may support speculative assets, while tighter liquidity can pressure them. |
These relationships are not automatic.
A strong balance sheet does not guarantee a rising stock price, and a weak balance sheet does not guarantee immediate collapse.
Valuation, industry structure, competitive advantage, interest rates, and market expectations all matter.
Still, balance sheet strength becomes increasingly important when liquidity disappears.
Key Balance Sheet Metrics Investors Should Check
Investors do not need to memorize every accounting line item.
A small group of balance sheet indicators can reveal a great deal about financial strength.
1. Cash and Cash Equivalents
Cash is the most flexible asset on the balance sheet.
It can be used to
- Repay debt
- Fund operations
- Invest in research
- Acquire competitors
- Repurchase shares
- Maintain dividends
- Survive an economic downturn
However, investors should compare cash with total debt.
A company with $10 billion in cash may appear strong, but that impression changes if it also carries $40 billion in debt.
This is why many investors look at net cash or net debt.
Net Debt = Total Debt − Cash and Cash Equivalents
If cash exceeds debt, the company may have a net cash position.
If debt exceeds cash, the company has net debt.
2. Current Ratio
The current ratio measures whether a company has enough short-term assets to cover short-term liabilities.
Current Ratio = Current Assets ÷ Current Liabilities
A current ratio above 1 means current assets exceed current liabilities.
However, there is no universal ideal level.
A software company may operate comfortably with a different current ratio than a retailer, airline, utility, or manufacturer.
Industry comparisons are more useful than applying one fixed standard to every company.
3. Quick Ratio
The quick ratio is a stricter liquidity measure because it excludes inventory.
Quick Ratio = Cash + Short-Term Investments + Accounts Receivable ÷ Current Liabilities
This metric can be especially helpful for companies whose inventory may be slow-moving, seasonal, or vulnerable to obsolescence.
4. Debt-to-Equity Ratio
The debt-to-equity ratio compares total debt or liabilities with shareholders’ equity.
Debt-to-Equity Ratio = Total Debt ÷ Shareholders’ Equity
A higher ratio may indicate greater financial leverage.
Leverage can amplify shareholder returns when business conditions are favorable.
It can also amplify losses when earnings decline or borrowing costs rise.
Investors should compare the ratio with
- Industry peers
- Historical levels
- Interest expense
- Cash flow stability
- Debt maturity schedules
5. Retained Earnings
Retained earnings can reveal whether a company has built shareholder capital over time.
A growing balance may reflect sustained profitability.
A deeply negative balance may reflect long-term losses, large distributions, aggressive share repurchases, or accounting adjustments.
The context matters.
Some mature U.S. companies may report unusual equity structures because of years of stock buybacks. Therefore, investors should not use retained earnings or book equity alone without reviewing cash flow and capital allocation history.
6. Accounts Receivable
Accounts receivable represents money customers owe the company.
If receivables rise much faster than revenue, investors should investigate.
Possible explanations include
- Customers are taking longer to pay
- The company is offering more generous credit terms
- Revenue recognition is becoming more aggressive
- Customer quality is deteriorating
Revenue is valuable only when it eventually turns into cash.
7. Inventory
Inventory includes raw materials, unfinished products, and finished goods.
Rising inventory is not always negative.
It may reflect preparation for stronger demand.
But if inventory grows while sales slow, the company may face discounting, write-downs, or weaker margins.
This is particularly important for
- Retailers
- Semiconductor companies
- Automakers
- Consumer electronics businesses
- Industrial manufacturers
The balance sheet often reveals weakening demand before the income statement fully reflects it.
8. Goodwill and Intangible Assets
Goodwill often appears after a company acquires another business for more than the value of its identifiable net assets.
It is not the same as cash, inventory, or property.
If an acquisition performs poorly, the company may be forced to record a goodwill impairment.
That accounting charge may reduce earnings and shareholders’ equity.
A large goodwill balance does not automatically mean a company is weak, but investors should ask whether past acquisitions are generating enough cash flow to justify their recorded value.
What Investors Should Look for Beyond the Headline Numbers
A strong balance sheet is not simply one with low debt.
Investors should examine the direction of the numbers over time.
Useful questions include
- Is cash increasing or decreasing?
- Is debt growing faster than earnings?
- Are receivables rising faster than sales?
- Is inventory building up?
- Is shareholders’ equity expanding?
- Is the company issuing new shares to fund losses?
- Are share repurchases reducing financial flexibility?
- Does the company have major debt maturities approaching?
- Are asset values realistic?
Trend analysis is often more useful than one quarter of data.
A balance sheet is a snapshot, but a series of balance sheets becomes a story.
It shows how management allocates capital, how aggressively the company borrows, and whether financial flexibility is improving or deteriorating.
What Do Wealthy Investors Look for in a Balance Sheet?

Experienced investors do not view the balance sheet as a static accounting table.
They use it to follow the movement of money.
They want to understand
- Where capital came from
- Where it is currently invested
- Whether it is producing cash
- How much risk is attached to it
- Whether the company can survive without outside funding
The Movement of Money
If revenue rises but accounts receivable and inventory rise even faster, reported growth may not be converting into cash.
This can be an early warning sign.
The company may be selling more products, but collecting money more slowly.
It may be producing more goods than customers are buying.
It may appear profitable while cash is becoming trapped inside working capital.
Cash Flow Capacity
Large investors often focus on whether the business can finance itself.
A company that depends on continuous debt issuance or new stock offerings may be vulnerable when market conditions tighten.
A company with strong internally generated cash flow has more control over its future.
It can continue operating even when capital markets become less supportive.
Asset Survival Value
Not all assets maintain value during a crisis.
Cash and high-quality securities are generally easier to use.
Specialized equipment, goodwill, outdated inventory, and speculative investments may lose value quickly.
Investors therefore ask not only how many assets a company owns, but how much those assets might be worth under difficult conditions.
Long-Term Financial Flexibility
The strongest companies often gain strategic advantages during downturns.
When competitors are forced to cut investment, strong companies can
- Hire talent
- Acquire assets at lower prices
- Expand market share
- Continue research and development
- Maintain shareholder distributions
- Negotiate better financing terms
This is why cash can become more valuable during a recession.
In strong markets, cash may look inefficient.
In weak markets, cash becomes optionality.
Before investing, consider asking
- Can this company operate for several years without raising new capital?
- Does it have enough cash to cover near-term debt maturities?
- Are its assets productive and realistically valued?
- Is debt being used to create durable cash flow or merely to support short-term results?
- Could higher interest rates materially weaken the business?
- Is management preserving financial flexibility or sacrificing it for aggressive buybacks and acquisitions?
- Would this company emerge stronger or weaker after a recession?
These questions move balance sheet analysis beyond accounting and into business strategy.
The Balance Sheet and the Importance of Survival
Investors naturally focus on growth.
They want to know which company will gain market share, launch the next breakthrough product, or dominate a new technology cycle.
But growth forecasts are uncertain.
Survival is more measurable.
No investor can perfectly predict the next recession, credit shock, interest-rate cycle, or technological disruption.
But investors can study whether a company has enough liquidity, cash flow, and balance sheet strength to survive a wide range of outcomes.
That is one of the most important lessons in investing
The best long-term opportunity is not always the company with the fastest growth. It may be the company with enough financial strength to keep investing after weaker competitors run out of capital.
Markets reward growth during optimistic periods.
They reward resilience when conditions become difficult.
Over a full economic cycle, the ability to survive can become a competitive advantage.
Final Thoughts
The balance sheet is not merely a list of assets and liabilities.
It is a map of a company’s financial foundation.
It shows
- What the business owns
- What it owes
- How much belongs to shareholders
- How much liquidity is available
- How dependent the company is on debt
- Whether it has the financial flexibility to survive and grow
The income statement may show impressive profits.
The stock price may reflect exciting expectations.
But the balance sheet reveals whether the company has the structure to support those expectations.
When analyzing a U.S. company, do not stop at revenue growth, earnings per share, or management guidance.
Look at cash.
Look at debt.
Look at receivables and inventory.
Look at the quality of assets.
Look at how the financial position has changed over several years.
The market is always trying to predict the future.
But successful long-term investing is not only about predicting what comes next.
It is also about identifying companies that can survive when the future does not unfold as expected.
A strong company is not simply one that earns money today. It is one with the financial structure to endure uncertainty, protect its cash flow, and continue compounding value over time.
This was MasterMind.
'[Global] Success Blueprints' 카테고리의 다른 글